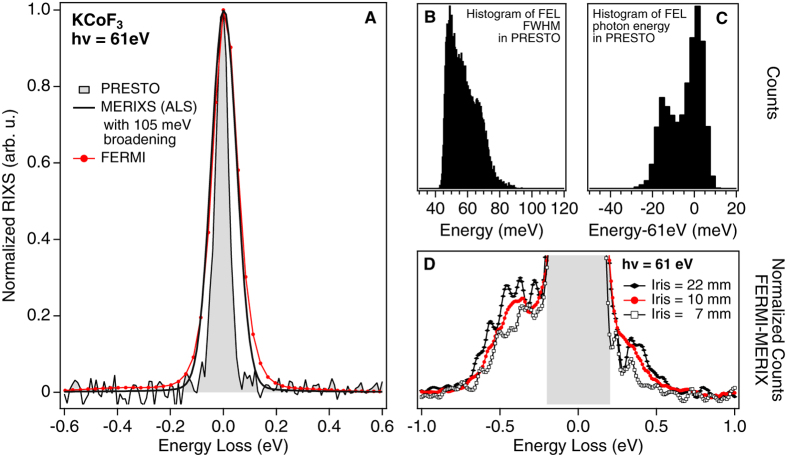
Figure 4.
(A) Elastic line measured at FERMI (red line) and at MERIXS (solid black line with additional 105 meV Gaussian broadening) on KCoF3. The resolution of the FERMI setup was 120 meV, evaluated from the FWHM of the elastic line. The filled trace represents the energy distribution of FEL integrated over the full measurement obtained by means of the on-line spectrometer PRESTO for FEL diagnostics. This comparison shows that the resolution is limited by the spectrometer settings and not by the FEL energy distribution. (B and C) Histograms of the FWHM and relative shift of the FEL photon energy determined for each shot in the measurement. (D) Elastic line tails in the FERMI data for different settings of the diameter of the beamline iris aperture. The datapoints show the difference between the normalized FERMI RIXS spectrum and the broadened MERIXS spectrum in Fig. 4A.

