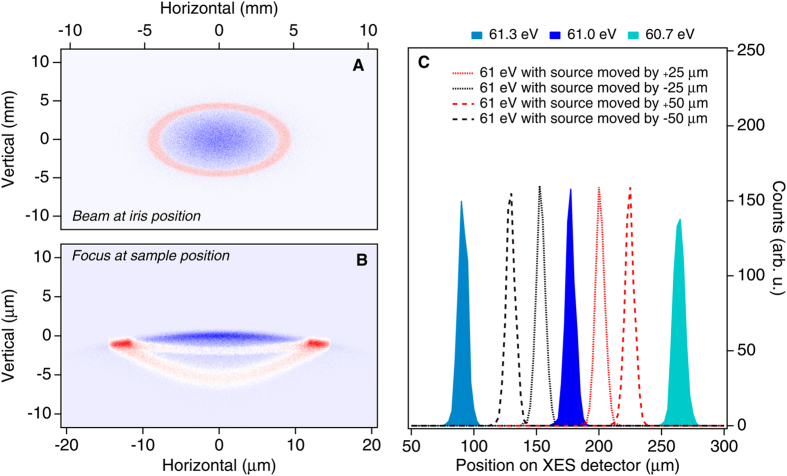
Figure 5.
(A and B) X-ray spot at the iris position (A) and at the sample position (B) obtained by a ray-tracing simulation with SHADOW. We considered a 61 eV X-ray beam with a spatial distribution comprising an inner core (blue area) and an annular mode (red area). (C) Ray-tracing of 61.0, 62.3 and 60.7 eV beams in the XES 355 spectrometer from the ideal focus of the 300 lines/mm grating (filled curved) and from a source point displaced laterally with respect to the ideal focus by 25 and 50 μm in both directions.

