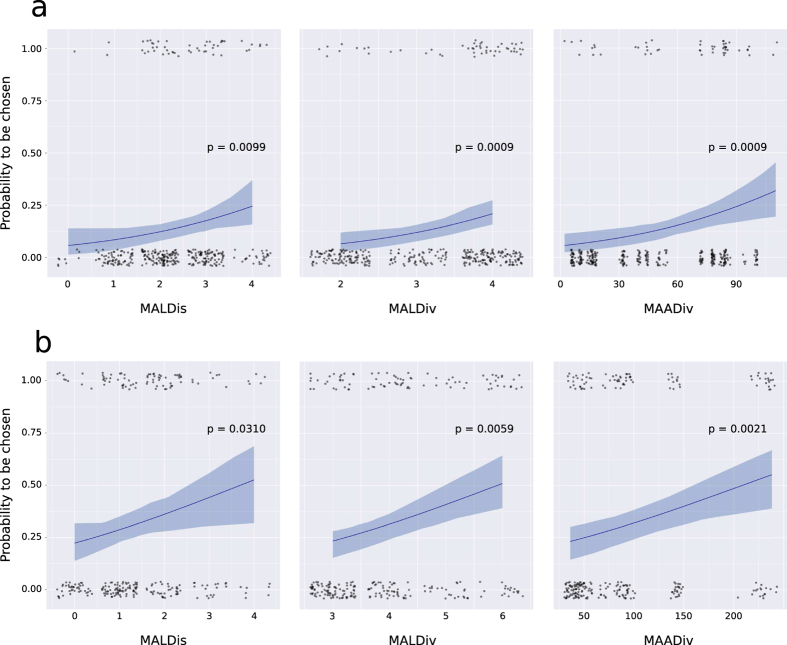
Figure 1. MHC-dependent female choice tested with linear modelling.
Regression curves fitted by GLMMs on the probability of males to be chosen by females based on three MHC genetic parameters, MALDis, MALDiv and MAADiv. The 95% confidence intervals (shaded areas) were generated by 105 bootstraps and the p-values are given above each curve. (a) MHC-I, 50 real couples were compared with 351 potential couples; (b) MHC-II, 83 real couples were compared with 258 potential couples. The transparency and the slight dispersion of data points around their values were used to improve readability.

