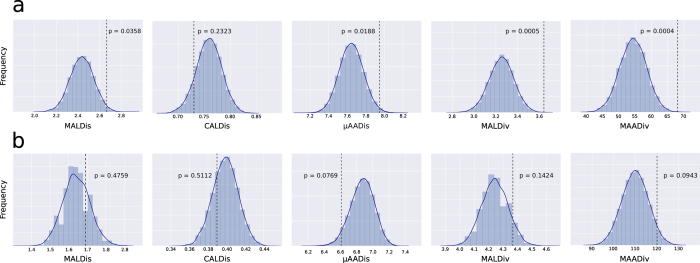
Figure 2. MHC-dependent female choice tested with Monte Carlo simulations.
Frequency distributions of MHC index means calculated from 105 Monte Carlo randomizations (blue bars) of potential male-female couples out of the sample studied, concerning the five MHC genetic indices. The mean values for the real couples (MALDis, CALDis and μAADis) or real fathers (MALDiv and MAADiv) are given in each plot by a dashed vertical line and the corresponding p-values are indicated. (a) MHC-I, 50 real couples were compared with 351 potential couples; (b) MHC-II, 83 real couples were compared with 258 potential couples.

