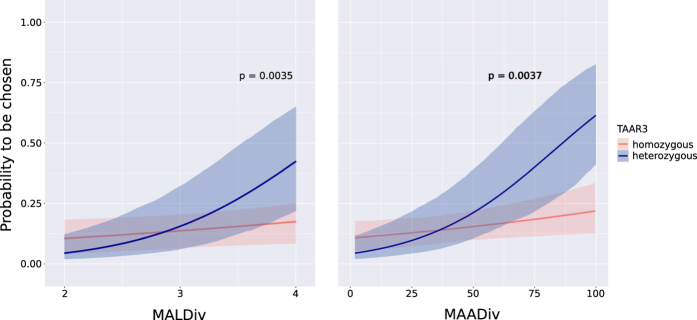
Figure 3. Effect of heterozygosity at the TAAR3 locus among females on their probability to choose males based on MALDiv and MAADiv indices at their MHC-I.
The p-values corresponding to the interaction between heterozygosity status and MHC diversity index are given above the curves, which represent heterozygous (blue) and homozygous (orange) females at the TAAR3 locus. All females involved in couples genotyped for MHC-I were also genotyped for TAAR3.

