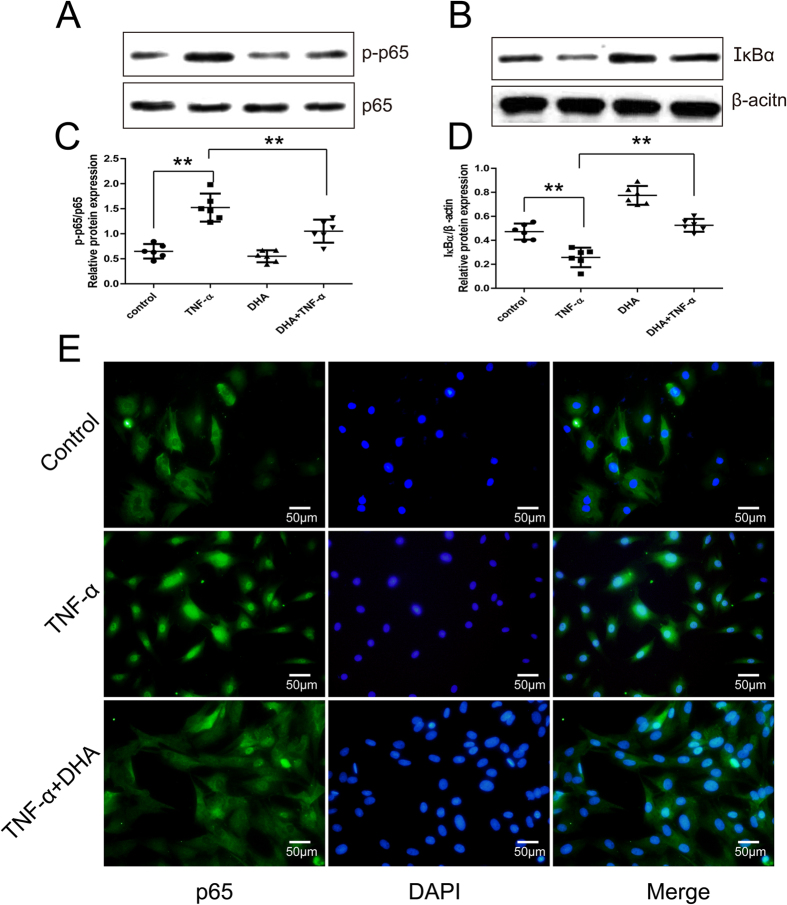
Figure 4. DHA’s effects on the NF-κB pathway in TNF-α-treated chondrocytes for 24 hours.
Representative images are shown. (A,C) Western blotting of p-p65 expression in TNF-α- and/or DHA -treated chondrocytes and the optical density of p-p65/p65 were analyzed. Data represent as mean ± 95% CI, **P < 0.01, n = 6. (B,D) Western blotting analysis of IκBα expression in TNF-α and/or DHA-treated chondrocytes, and the optical density of IκBα/β-actin was analyzed. Data represent mean ± 95% CI, **P < 0.01, n = 6. (E) Immunofluorescence of NF-κB p65 in TNF-α- and/or DHA-treated chondrocytes.

