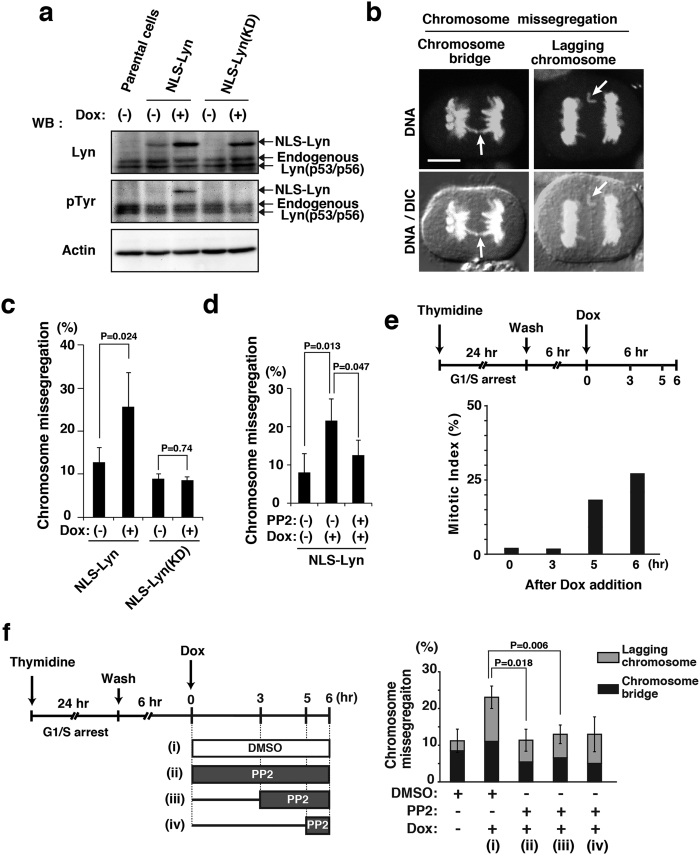
Figure 2. Chromosome missegregation induced by NLS-Lyn.
HeLa S3/TR cells stably expressing inducible NLS-Lyn (HeLa S3/NLS-Lyn cells) or inducible NLS-Lyn(KD) (HeLa S3/NLS-Lyn(KD) cells) and HeLa S3/TR parental cells were arrested at G1/S phase by 24 h-thymidine treatment, subsequently released into fresh medium for 12 h, and incubated with 1 μg/ml Dox during the last 6 h (see e). (a) Cells were arrested at G1/S phase, released for 6 h, and incubated for 6 h in medium with or without Dox. Whole cell lysates from HeLa S3/NLS-Lyn, HeLa S3/NLS-Lyn(KD), and vector-transfected HeLa S3/TR parental cells were analyzed by Western blotting using anti-Lyn, anti-phosphotyrosine (pTyr), and anti-actin (loading control) antibodies. Full-length blots are presented in Supplementary Fig. S1. (b) Dox-treated HeLa S3/NLS-Lyn cells were stained for DNA. Arrows indicate an anaphase bridge and a lagging chromosome (phenotypes of chromosome missegregation). Scale bar, 10 μm. (c) HeLa S3/NLS-Lyn cells and HeLa S3/NLS-Lyn(KD) cells were treated with Dox for 6 h (see e). The number of cells exhibiting chromosome missegregation was counted. Values are means ± S.D. from more than three independent experiments [HeLaS3/NLS-Lyn (>483 cells), HeLa S3/NLS-Lyn(KD) (>516 cells)], and the significant difference is calculated by the Student’s t-test. P = 0.74 indicates no significant difference. (d) HeLa S3/NLS-Lyn cells were treated with 10 μM PP2 for the last 3 h during Dox treatment (see f). The number of cells exhibiting chromosome missegregation was counted. Values are means ± S.D. from more than three independent experiments [HeLa S3/NLS-Lyn (>426 cells)], and the significant differences are calculated by the Student’s t-test. (e) Schematic depiction of cell synchronization and PP2 treatment. The appearance of mitotic cells was examined after Dox addition by counting the number of H3pS10-positive HeLa S3/NLS-Lyn cells (mitotic index). (f) Schematic depiction of cell synchronization and stepwise PP2 addition. HeLa S3/NLS-Lyn cells were treated with or without 10 μM PP2 for the indicated times. The number of cells exhibiting chromosome missegregation was counted. Significant differences are calculated by the Student’s t-test.

