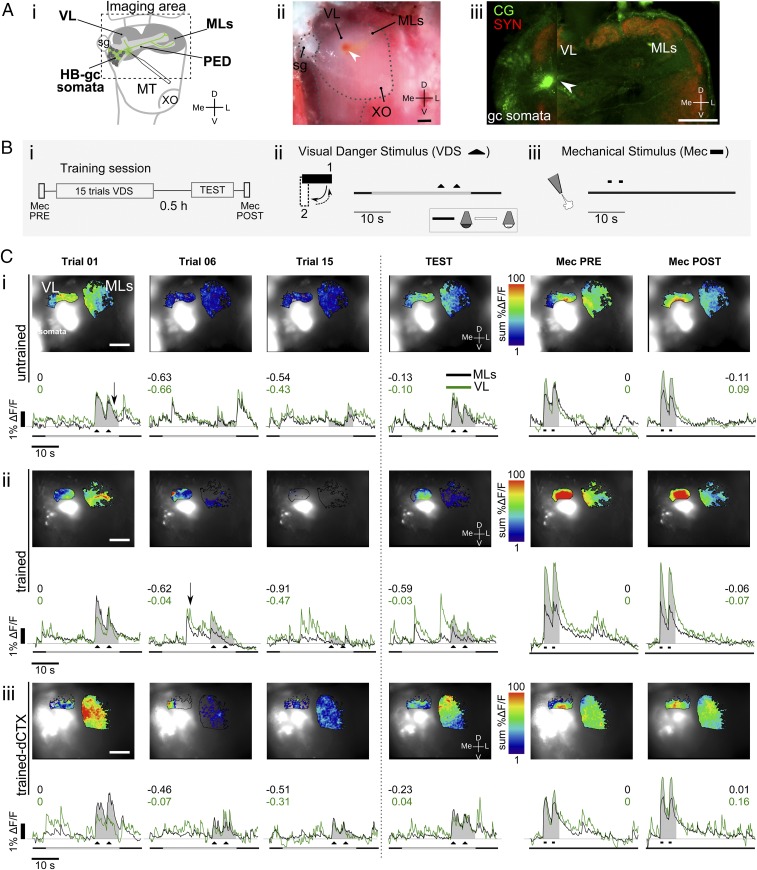
Fig. 4.
In vivo calcium imaging preparation and neural activity in the crab’s HB. (A) Preparation for calcium imaging experiments. (i) Diagram of the lateral protocerebrum showing the site where the crystals of calcium dye were stabbed with a glass capillary. A complete gc and some somata of the HB drawn in green represent cells filled with the dye. A dashed frame outlines the approximately recorded area during experiments. (ii) Picture of the preparation under the stereomicroscope. The red spot corresponds to the Calcium Green crystals, which look red under white light. (Scale bar: 100 μm.) (iii) Confocal stack showing immunoreaction against SYN and Calcium Green staining. (Scale bar: 200 μm.) (B) Training protocol and scheme of the stimulation trials. (i) Training protocol consists of 15 VDS trials followed by a short-term test 0.5 h later. A Mec is delivered before training (PRE) and after testing (POST) as a control stimulus. (ii) VDS consists of a screen moving back and forth 90° above the animal (black triangles). The trial consists of a delayed context-VDS presentation. The time line represents the whole extent of each recording event (40 s), including the 27 s in which illumination changes from below to above, and the VDS toward the end of this period. Dark line, below illumination; white line, above illumination. (iii) Mec consists of two 1-s pulses of nitrogen at the dorsal posterior part of the crab’s carapace (black rectangle denotes the Mec timing). (C) Examples of calcium dynamics. (Upper) Superimposed raw and false color-coded images for the ML and VL areas showing neuronal calcium responses as the summation of change in fluorescence (sum %ΔF/F) upon stimulation for training trials 1, 6, and 15 and the test, and Mec for the medial and vertical lobes. The white glow corresponds to intensity saturation, where the dye was stabbed. (Scale bar: 200 μm.) (Lower) Time course calcium dynamics as %ΔF/F during trials corresponding to the image in the upper row. The shaded area shows the time window considered for summation of the activity elicited by the stimulus and used for calculation of the CSR. Numbers in black and green show the CSR for each trial and each lobe. MecPRE/POST, Mec pretraining or posttesting. (i) UN crab example. (ii) TR crab example. (iii) TR-dCTX crab example.

