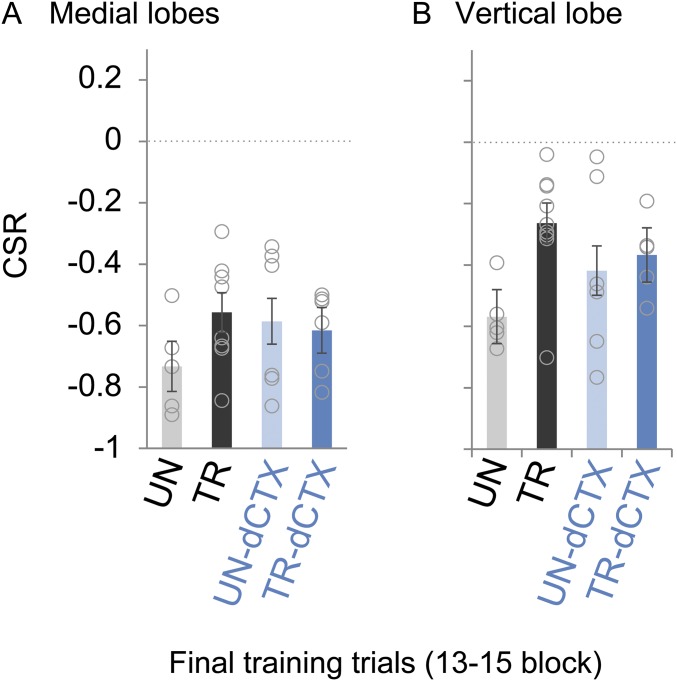
Fig. S1.
HB calcium imaging activity during the final training trials block (related to Fig. 5). A CSR corresponding to the last three training trials for the four experimental groups is shown. Notice that UNs are not stimulated with the VDS. In analysis by one-way ANOVA, no differences between groups were found in the medial lobes (A) or in the vertical lobe (B). Circles represent individual animals.

