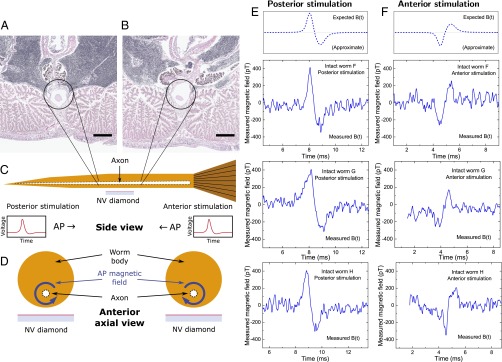
Fig. 4.
Single-channel magnetic sensing of AP propagation exterior to live, intact organism. Transverse sections of M. infundibulum near midpoint of worm illustrate giant axon radius tapering from (A) smaller near posterior to (B) larger near anterior. Sections were taken cm apart. Encircled white structure is giant axon. (Scale bars, 400 μm.) (C) Cartoon cross-section side view of live, intact worm and NV diamond sensor. Black dashed lines indicate tapered giant axon. Cartoon time traces of AP voltage indicate they are typically qualitatively indistinguishable for posterior stimulation (right-propagating AP) and anterior stimulation (left-propagating AP). (D) Cartoon cross-section axial view looking from anterior end. Blue arrows encircling axon indicate opposite azimuthal AP magnetic field vectors for oppositely propagating APs. (E) (Top) Expected AP magnetic field time trace for posterior AP stimulation of M. infundibulum, indicating effect of AP propagation direction and conduction velocity on sign of bipolar magnetic field waveform and magnetic field amplitude. (Bottom) Recorded time trace of AP magnetic field Bmeas(t) from three live intact specimens of M. infundibulum for posterior stimulation and Navg = 1,650 events each. (F) (Top) Expected AP magnetic field time trace for anterior worm stimulation. (Bottom) Recorded time trace of AP magnetic field Bmeas(t) from same three intact live specimens of M. infundibulum as in E for anterior stimulation and Navg = 1,650 events each. Note that the observed sign of Bmeas(t) is reversed depending on AP propagation direction, and the average ratio of the magnetic signal amplitude of posterior-stimulated APs (Bp) and anterior-stimulated APs (Ba) from the three specimens shown (worms F, G, and H) is Bp/Ba = 1.41 ± 0.22 (mean ± SD for three samples, each with Navg = 1,650), consistent with two-point electrophysiology measurements of lower AP conduction velocity for posterior stimulation (see SI Appendix and Fig. S2).

