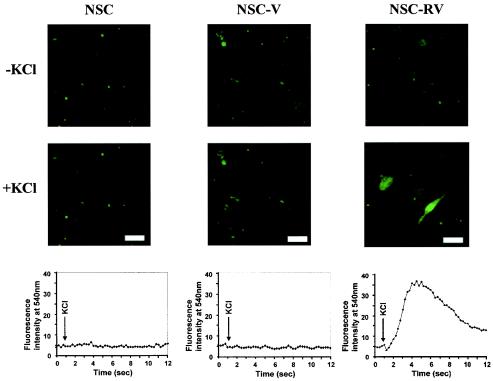
FIG. 5.
NSC-RVs show depolarization-dependent calcium influx. NSCs, NSC-Vs, or NSC-RVs (−Dox) from the cells shown in Fig. 4 were loaded with 25 μM Fluo-3 AM for 60 min at room temperature. The Fluo-3 AM solution was replaced with high-KCl Ringer solution, and an image was taken every 0.25 s for a total of 12 s after depolarization. Fluorescence intensity is shown at the bottom. Bars, 60 μm.

