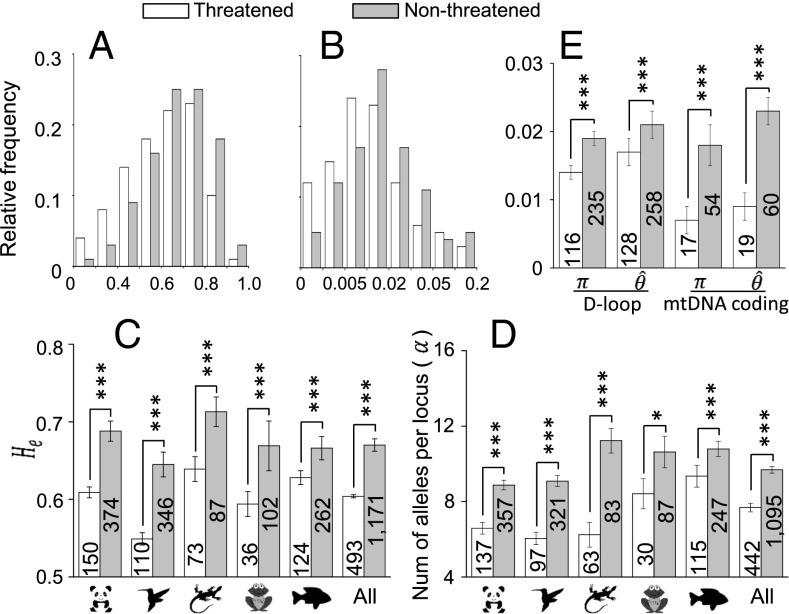
Fig. 3.
Comparisons of genetic diversity between nonthreatened and threatened vertebrate species. (A) Empirical distributions of on microsatellite loci. (B) Empirical distributions of Watterson’s calculated from sequence variation in the D-loop (control region) of mitochondrial DNA. (C) Results of the permutation test on of microsatellite loci between nonthreatened and threatened species. (D) Results of the permutation test on the number of alleles per microsatellite locus () between nonthreatened and threatened species. (E) Results of the permutation test on Watterson’s and the mean pairwise nucleotide differences () in the D-loop and coding regions in the mitochondrial genome. The null hypothesis of the permutation test is that the mean genetic diversity of nonthreatened species is equal to that of threatened species. The numbers of species examined are shown on the columns, and the one-tailed P values of the test are shown above the columns. The SEM is presented as an error bar. To ensure a reliable estimation of genetic diversity for a species, we required a sample size of individuals. *P < 0.05, ***P < 0.01.

