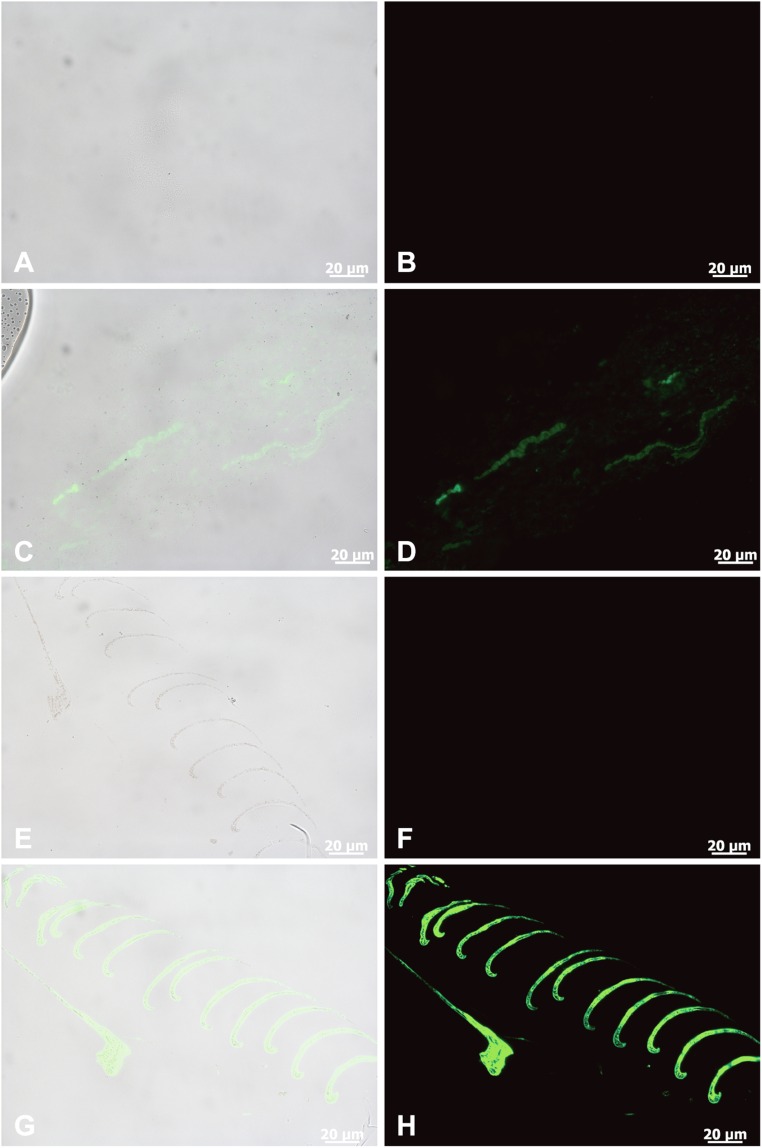
Fig. 3.
Immunofluorescence results of fossil feathers (sample 205, propatagium, which is covered dorsally and ventrally by feathers) compared with feathers of G. gallus. (A, C, E, and G) Overlay images showing where the antibodies bind to tissues (green) superimposed on transmitted light images. (B, D, F, and H) Fluorescence images showing only antibody binding, as represented by green fluorescence of the FITC label. (A and B) Negative control corresponding to C and D, where the primary antibody is omitted. (C and D) Eoconfuciusornis feathers exposed to anti-feather antibody demonstrates specific and localized antibody binding, as reflected by green fluorescence signal. (E and F) Negative control, with the primary antibody omitted. (G and H) In situ fluorescence signal corresponding to bound antibodies on the feather tissue of G. gallus. Binding patterns are similar between samples, although the ancient feathers show reduced binding as indicated by less intense fluorescence signal. All data were collected under identical conditions and all images were processed identically. (Scales are as indicated.)

