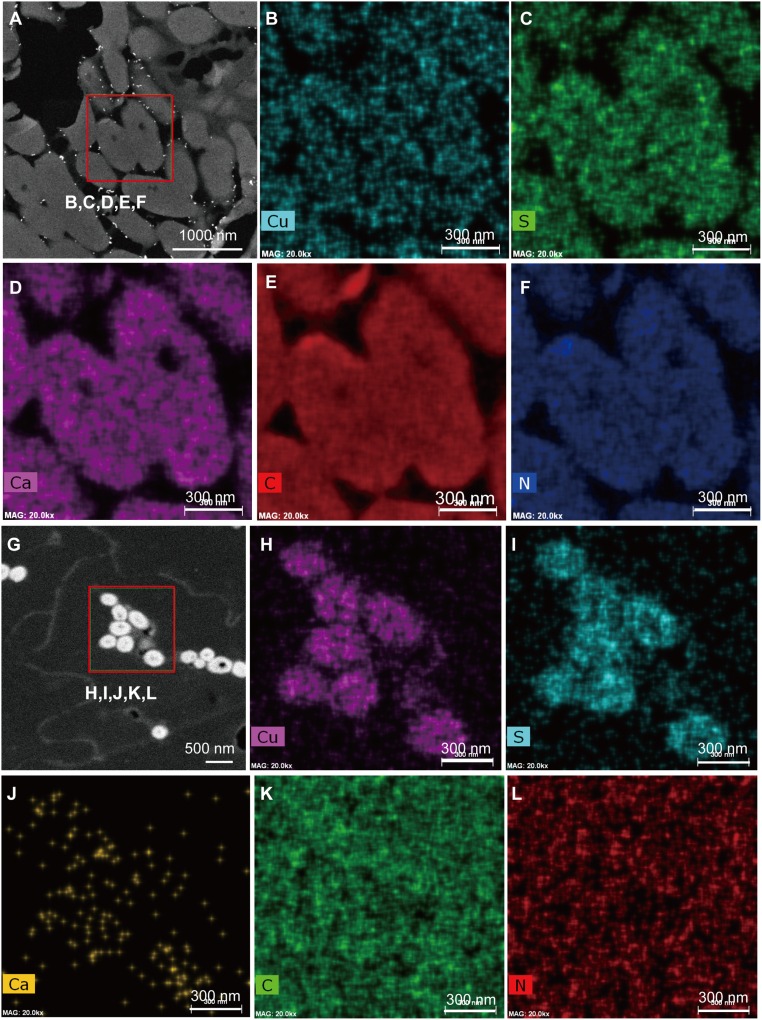
Fig. 6.
ChemiSTEM data derived from the microbodies of feather samples from Eoconfuciusornis (A–F), compared with melanosomes of a black feather from G. gallus (G–L). (A) HADDF image showing the selected region for elemental mapping. (B–F) Various element distributions for the selected region. (B) Cu map. (C) S map. (D) Ca map. (E) C map. (F) N map. (G) HADDF image showing the region on the G. gallus feather selected for elemental mapping. (H–L) Various element distributions for the selected region. (H) Cu map. (I) S map. (J) Ca map. (K) C map. (L) N map. (Scales are as indicated.)

