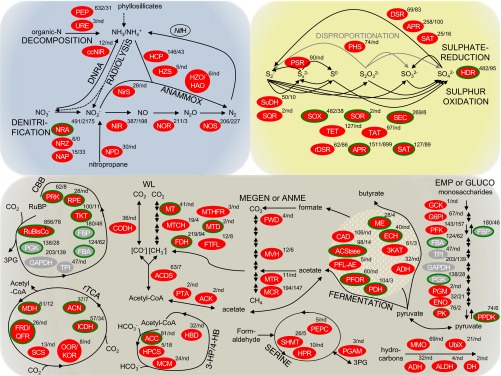
Fig. 1.
Metabolic pathways expressed in the deep subsurface. Pathways of N, S, and C metabolisms are enclosed in blue, yellow, and brown envelopes, respectively. Black and gray solid lines indicate reactions mediated by enzymes, whereas black dotted lines in the N cycle indicate abiotic reactions. PEG transcripts and the encoded enzymes detected in this study are denoted by ellipses, appended with coverage (mapped read counted normalized to PEG transcript length) and, if detected, the number of peptide spectral matches in metaproteome. Green-outlined enzymes are encoded by PEG transcripts related to Sulfuritalea and Thauera. Enzymes in gray operate in both autotrophic and heterotrophic C metabolisms, and the PEG transcripts detected in this study were closely related to those of autotrophs and heterotrophs. NifH gene, encoding for dinitrogenase reductase subunit H, was detected by RT-PCR cloning (SI Appendix, SI Materials and Methods, Table S4). A complete list of proteins detected in the PEG transcriptome and metaproteome is provided in SI Appendix, Table S6. ANAMMOX, anaerobic ammonium oxidation; ANME, anaerobic methane oxidation (upward direction); CBB, Calvin–Benson–Bassham cycle or reductive pentose phosphate cycle; DNRA, dissimilatory nitrate reduction to ammonia; EMP, Embden–Meyerhof–Parnas glycolysis (downward direction); GLUCO, gluconeogenesis (upward direction); 3-HP/4-HB, 3-hydroxypropionate/4-hydroxybutyrate (3-HP/4-HB) cycle; MEGEN, methanogenesis (downward direction); nd, not detected; 3PG, 3-phosphoglycerate; rTCA, reverse tricarboxylic acid cycle; SERINE, formaldehyde assimilation via serine pathway; WL, Wood–Ljundahl or reductive acetyl-CoA pathway.

