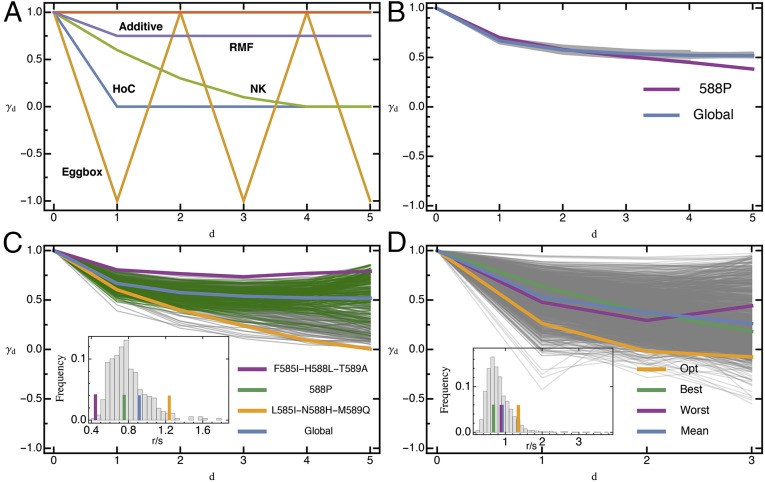
Fig. 4.
(A) Expected pattern of landscape-wide epistasis measure (SI Appendix, Eq. S1_15) with mutational distance for theoretical fitness landscapes with 6 loci from ref. 14. (B) Observed decay of with mutational distance under the drop-one approach is quite homogenous, except when hot spot mutation 588P is removed; 95% CIs are contained within the lines for the global landscape. (C) Observed decay of for all diallelic six-locus sublandscapes. Depending on the underlying mutations, is vastly different, suggesting qualitative differences in the topography of the underlying fitness landscape and in the extent of additivity in the landscape. Three focal landscapes representative of different types and for the full landscape have been highlighted. (D) Observed decay of for all diallelic four-locus sublandscapes containing the parental type, indicative of locally different landscape topographies. Highlighted are the three focal landscapes. (Insets) Histograms of the roughness-to-slope ratio for the respective subset, with horizontal lines indicating values for highlighted landscapes [ for global landscape (blue) is significantly different from HoC expectation, ]. Similar to , there is a huge variation in for subparts of the fitness landscape, especially when considering the four-locus subsets.

