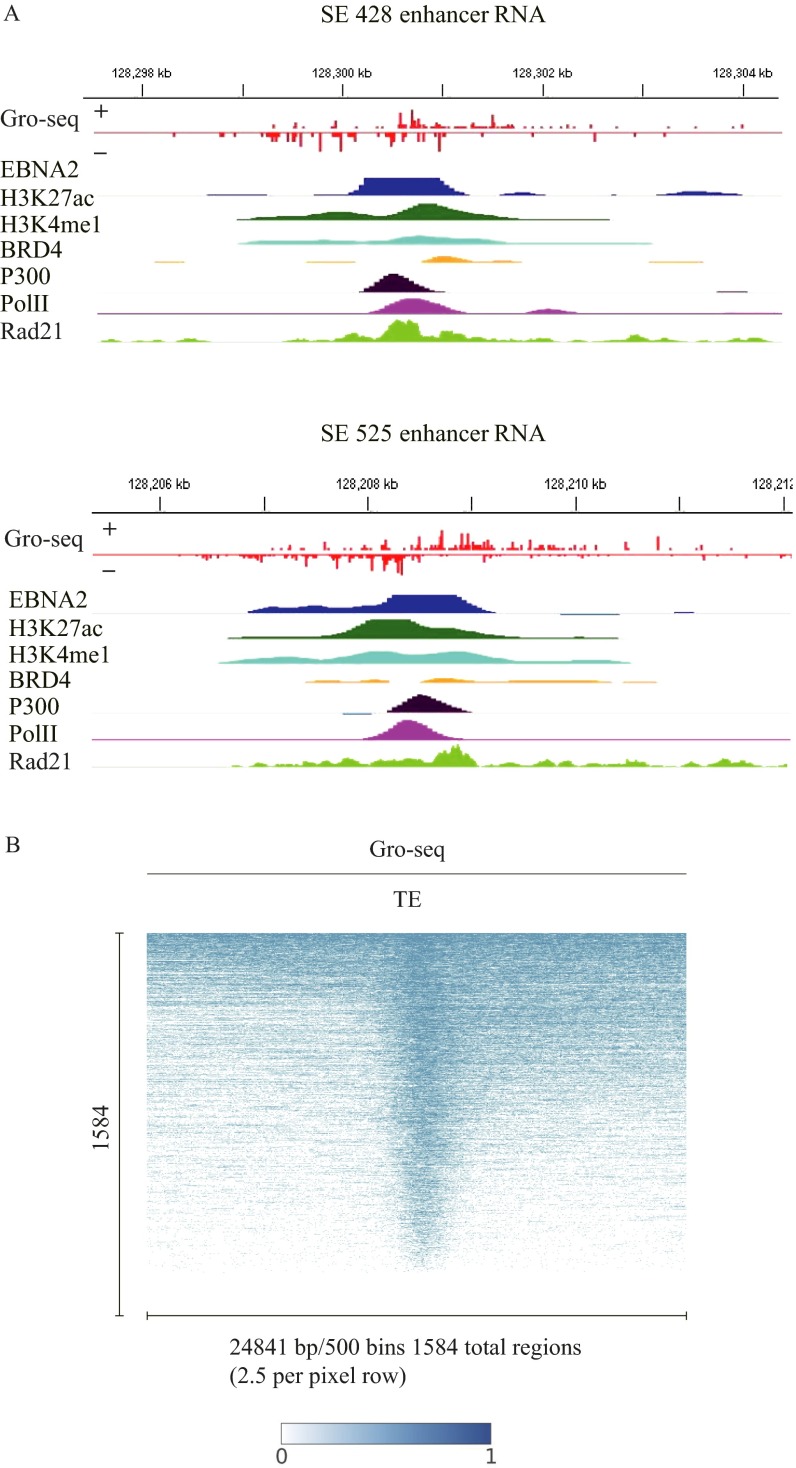
Fig. S1.
eRNA expression at MYC locus and EBV typical enhancers. (A) EBNA2, H3K27ac, H3K4me1, BRD4, P300, Pol II, and RAD21 ChIP-seq signals and GRO-seq signals of eRNA expression from both forward and reverse strands at the −428 MYC ESE and −525 MYC ESE. (B) ETE eRNA expression levels at 1,584 ETEs as determined by LCL GRO-seq. GM12878 LCL GRO-seq data were analyzed and visualized by following ref. 46. The minimum value is 0, whereas the maximum value is 1, and the signal is normalized accordingly from max to min in the scale of 1–0.

