FIG. 3.
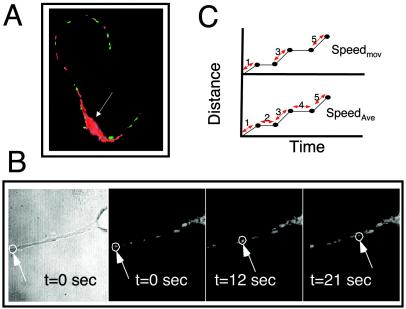
Analysis of mitochondrial motion in neurons from control, transgenic, and htt KO mice visualized by TMRM staining. (A) Image of striatal neuron stained with TMRM; red are stationary mitochondria and green are moving mitochondria identified by computer and appropriately colored. Most moving mitochondria are in the neurites. The arrow indicates the cell body. (B) An example of time-lapse recording of a TMRM-stained mitochondrion moving in the R direction along the axon in an E17 striatal neuron. Phase and fluorescence images are shown. The arrow and circle indicate the mitochondrion being traced. (C) Schematic diagram of speed calculations used in the analysis of mitochondrial movement. Speedmov (speed when moving) was calculated by dividing the distance over time for every step in which mitochondria moved (double arrows), and data were averaged. In this example, time equals the sum of steps 1, 3, and 5. No time for stationary phases was included. SpeedAve (average speed) was calculated by dividing distance by total time that includes both moving and stationary phases (sum of steps 1, 2, 3, 4, and 5).

