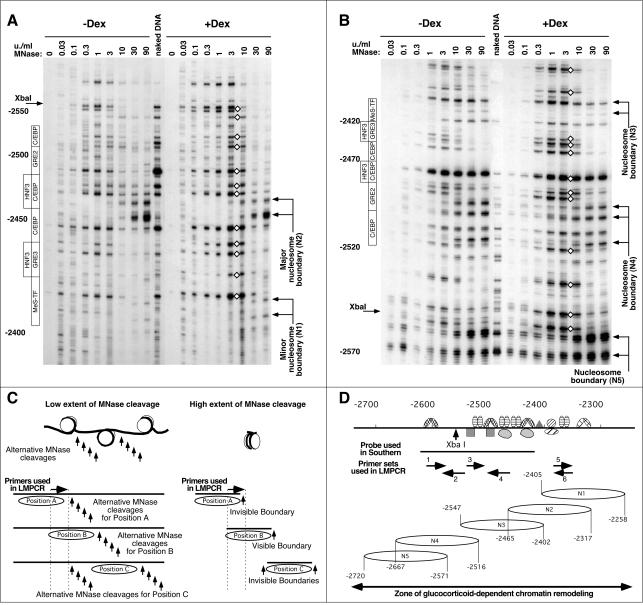
FIG. 3.
High-resolution MNase cleavage analysis reveals multiple nucleosomal frames and partial disruption of nucleosomal organization without nucleosome repositioning upon remodeling. (A) LM-PCR analysis of the MNase cleavage pattern at the −2.5 GRU using primer set no. 6. The locations of the transcription factor binding sites are indicated on the left. The locations of the deduced boundaries of nucleosome N1 and N2 are indicated on the right. Diamonds indicate GC-induced hyperreactivity. (B) LM-PCR analysis of the MNase cleavage pattern at the −2.5 GRU using primer set no. 1. The boundary of nucleosome N3 is only faintly visible here, as primers from set no. 1 hybridize to the corresponding 3′ linker region, but the boundaries of this nucleosome are clearly detected with primer sets no. 3 and no. 4 (see panel D). (C) Schematic interpretation of the cleavage patterns obtained at low and high extents of MNase cleavage for three arbitrary nucleosome positions (A, B, or C). The LM-PCR primers hybridize to a region that is fully protected only by nucleosome B. See the text for a detailed description. (D) Representation of the location of the nucleosome positions detected, as well as depiction of the primer sets used, of the transcription factor binding sites (36), of the probe used in Fig. 2A, and of the area of GC-dependent remodeling as revealed from the high-resolution DNase I analysis shown in Fig. 6C.

