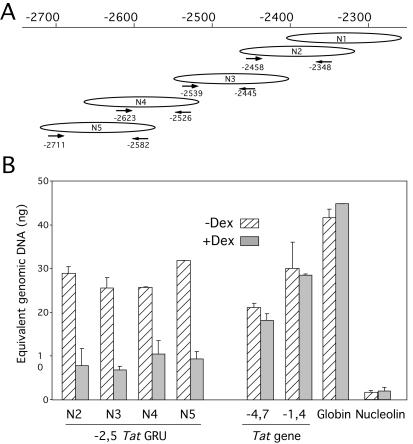
FIG. 4.
The multiple nucleosomal frames at the −2.5 GRU have similar frequencies and are equally remodeled upon GC stimulation. (A) Location of the primers used to quantify specifically nucleosomal frames N2 to N5. The primers are represented below the specific frame they recognize. (B) Quantification of each nucleosomal frame using real-time PCR. Nuclei from formaldehyde-cross-linked cells were treated with MNase so that >95% of the DNA had mononucleosomal length. Following cross-link reversion and DNA purification, the abundance of each sequence was quantified relative to a standard curve of sonicated genomic DNA.

