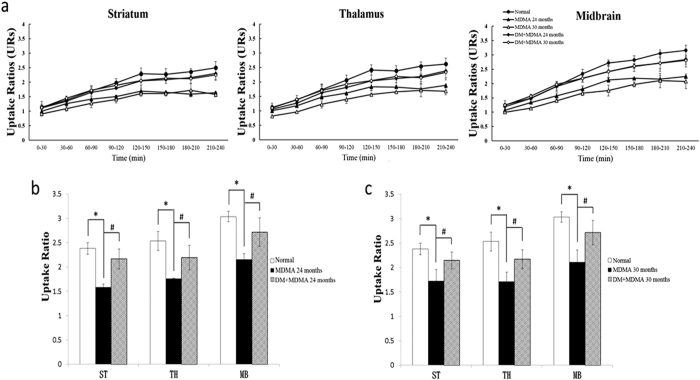
Figure 3.
(a) Time-course of mean URs in striatum, thalamus and midbrain at different time points in normal, MDMA and DM+MDMA groups. (b) URs of [123I]-ADAM SPECT during 210–240 min post-injection in various brain regions of normal, MDMA DM+MDMA groups at 24 months. These results are presented as mean ± S.D. *P < 0.05. compared with normal group; #P < 0.05. compared with MDMA group. (c) URs of [123I]-ADAM SPECT during 210–240 min. in various brain regions of normal, MDMA and DM+MDMA groups at 30 months. These results are presented as mean ± S.D. *P < 0.05. compared with normal group; #P < 0.05. compared with MDMA group.

