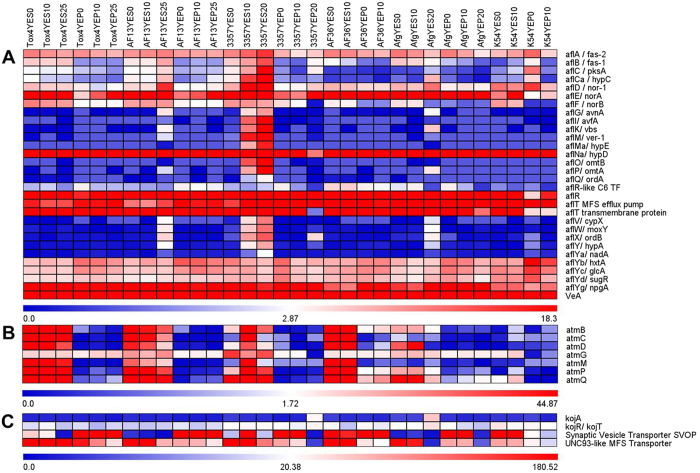
Figure 2. Heatmap of secondary metabolite biosynthetic gene expression.
Expression of genes involved in the biosynthesis of aflatoxin (A), aflatrem (B), and kojic acid (C) are plotted with colors corresponding to the FPKM’s of the genes within each isolate and treatment combination. For each heatmap, individual keys are located at the base of each plot with FPKM values increasing from blue to red. Isolate and treatment labels at the top of the figure apply throughout.

