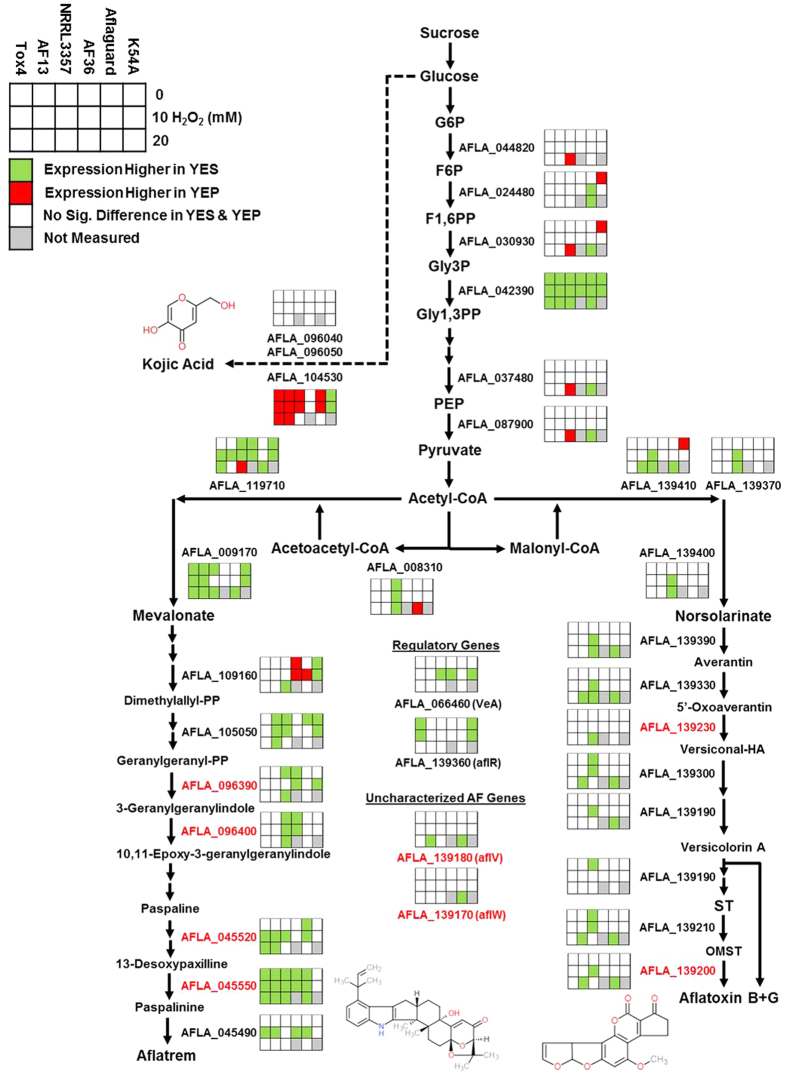
Figure 4. Differential expression of genes involved in glycolysis and secondary metabolite biosynthesis.
The 6 × 3 tables beside the gene annotations indicate significant changes in gene expression between YES (yeast extract sucrose) and YEP (yeast extract peptone) media for each isolate when exposed to H2O2 (0, 10, and 20 or 25 mM). Green and red colors indicate significantly higher expression of the genes in YES and YEP, respectively. White color represents no significant difference between YES and YEP; and gray color represents comparisons not measured in the experiment. Red colored points in molecular models represent the occurrence of oxygen atoms. Red colored text for gene annotations represent cytochrome p450 monooxygenase-coding genes present in the aflatoxin and aflatrem biosynthetic pathways. Abbreviations: G6P, glucose-6-phosphate; F6P, fructose-6-phosphate; F1,6 P, fructose-1,6-bisphosphate; Gly3P, glyceraldehyde-3-phosphate; Gly1,3PP, glyceraldehyde-1,3-bisphosphate; PEP, phosphoenolpyruvate.

