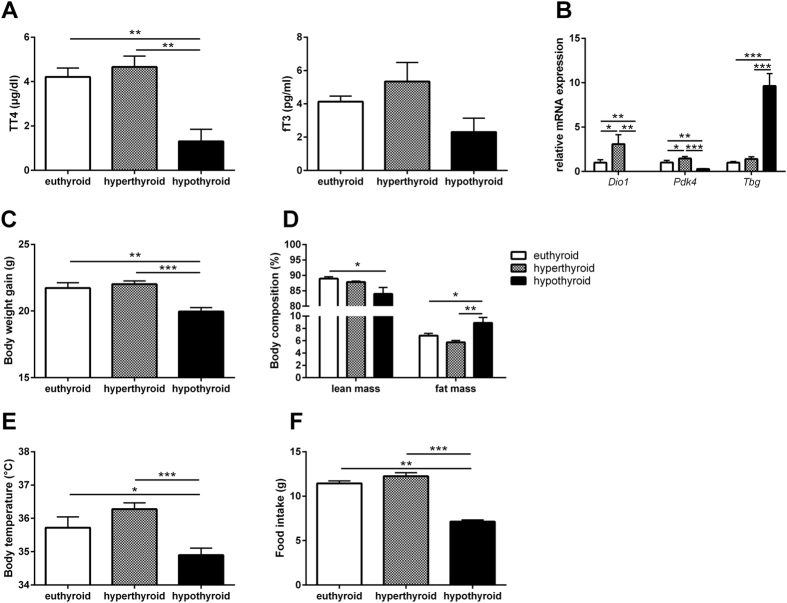
Figure 1. Thyroid state and phenotypic characterization of hyper- hypo- and euthyroid mice.
(A) Total T4 and free T3 serum concentrations, (B) Hepatic expression of TH-responsive genes, (C) Final body weight and (D) Lean and fat mass and (E) Body temperature and (F) food intake of eu-, hyper-, and hypothyroid mice. n = 10 mice per group; data are presented as mean and SEM (*p < 0.05, **p < 0.01, ***p < 0.001).

