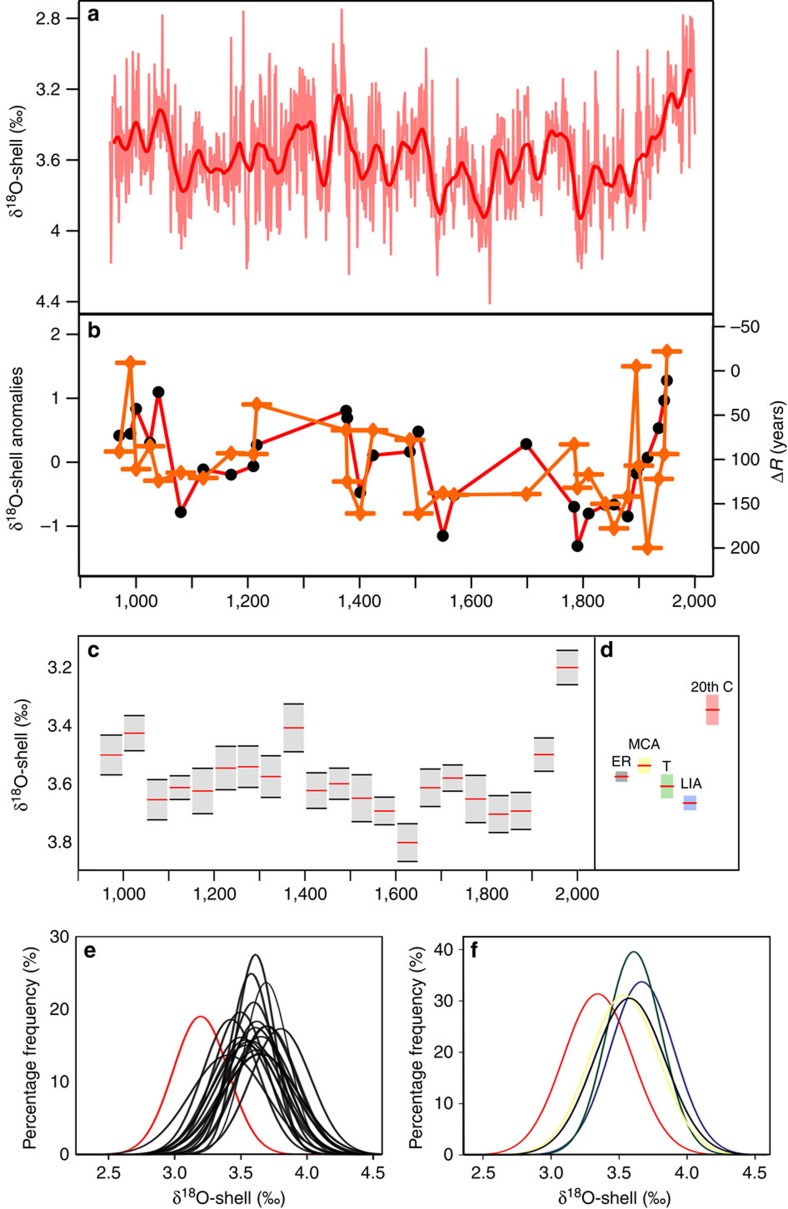
Figure 2. The δ18O-shell series and ΔR record.
(a) The annually resolved δ18O-shell series (pink line) plotted with a 30-year loess first-order low-pass filter (thick red line). (b) The North Icelandic marine reservoir age series21 (orange line with diamonds and bar) and the δ18O-shell values for the corresponding years (red line with black dots). The δ18O-shell series was low-pass filtered to match the temporal resolution of the ΔR record. (c) Mean δ18O-shell values plotted with associated 95% confidence intervals calculated over 50-year bins (with zero years overlap) and (d) mean δ18O-shell values calculated over the twentieth century (20th C; red bar), the Little Ice Age (LIA; blue bar), the MCA-LIA transition (T; green Bar), the Medieval Climate Anomaly (MCA; yellow bar) and the entire isotope record (ER; grey bar). (e,f) Percentage frequency distributions of the δ18O-shell record calculated over (e) 50-year bins (red line corresponds to 1951–2000, whereas the black lines correspond the previous 50-year bins) and (f) the twentieth century (red line), the Little Ice Age (blue line), the MCA-LIA transition (green line), the Medieval Climate Anomaly (yellow line) and the entire isotope record (black line).

