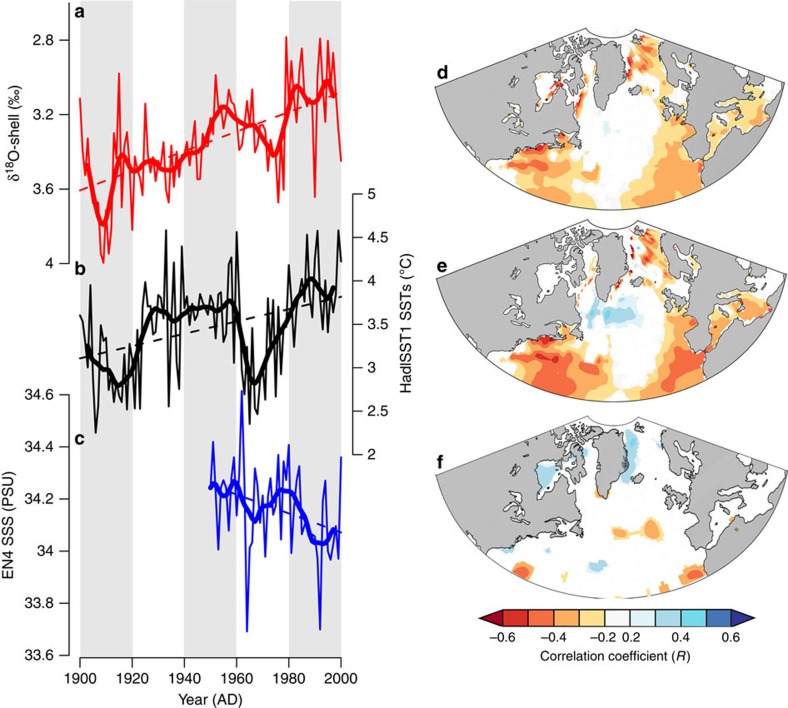
Figure 3. Spatial and temporal examination of the δ18O-shell data with instrumental oceanographic time series.
(a–c) Plots of the annual (thin lines) and 10-year low-pass-filtered (thick lines) (a) δ18O-shell, (b) HadISST1 gridded SST data and (c) EN4 gridded SSS. (d,e) Spatial correlations between the δ18O-shell and HadISST1 SST over (d) the growing season (March to October) and (e) the preceding winter (December to February). The correlations are calculated over the period 1870–2000. (f) Spatial correlations between the δ18O-shell and the EN4 SSS gridded SSS data set. Correlations calculated over the period 1950–2000. All correlations shown are significant with a P<0.1. Instrumental displayed in b,c are derived from a 10° by 20° grid box (65–75°N 10–30°W) north of Iceland. Spatial correlations generated using the KNMI climate explorer (https://climexp.knmi.nl/).

