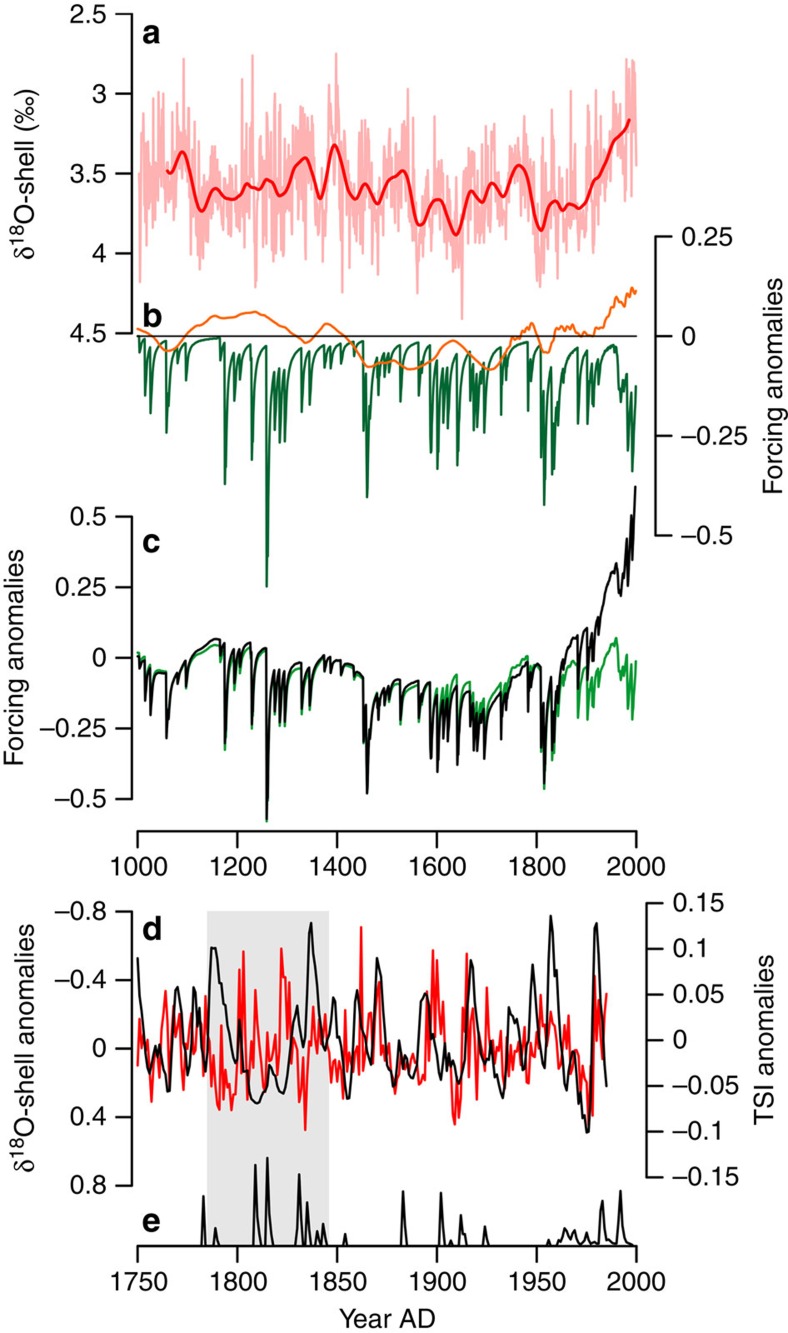
Figure 5. The δ18O-shell series and climate forcings.
Comparison between (a) the inverted δ18O-shell anomalies (annually resolved and 50-year loess low-pass-filtered data shown by the pink and red lines, respectively) with (b) individual climate forcing indices (TSI and volcanics shown by the orange and green lines, respectively), and (c) combined natural forcings (solar and volcanics; green line) and combined total forcing (solar, volcanics, greenhouse gases, aerosols; black line). (d) Plot of the 50-year loess first-order high-pass-filtered TSI (black line) and inverted δ18O-shell anomalies (red line) over the period AD 1750–1997. (e) Timing of volcanic eruptions over the AD 1750–1997 period. The grey box highlights the 2 consecutive 30 periods following the Laki (1783) and Tambora (1815) volcanic eruptions, which probably dominate the climate signal over this period. Climate forcing data from Crowley2.

