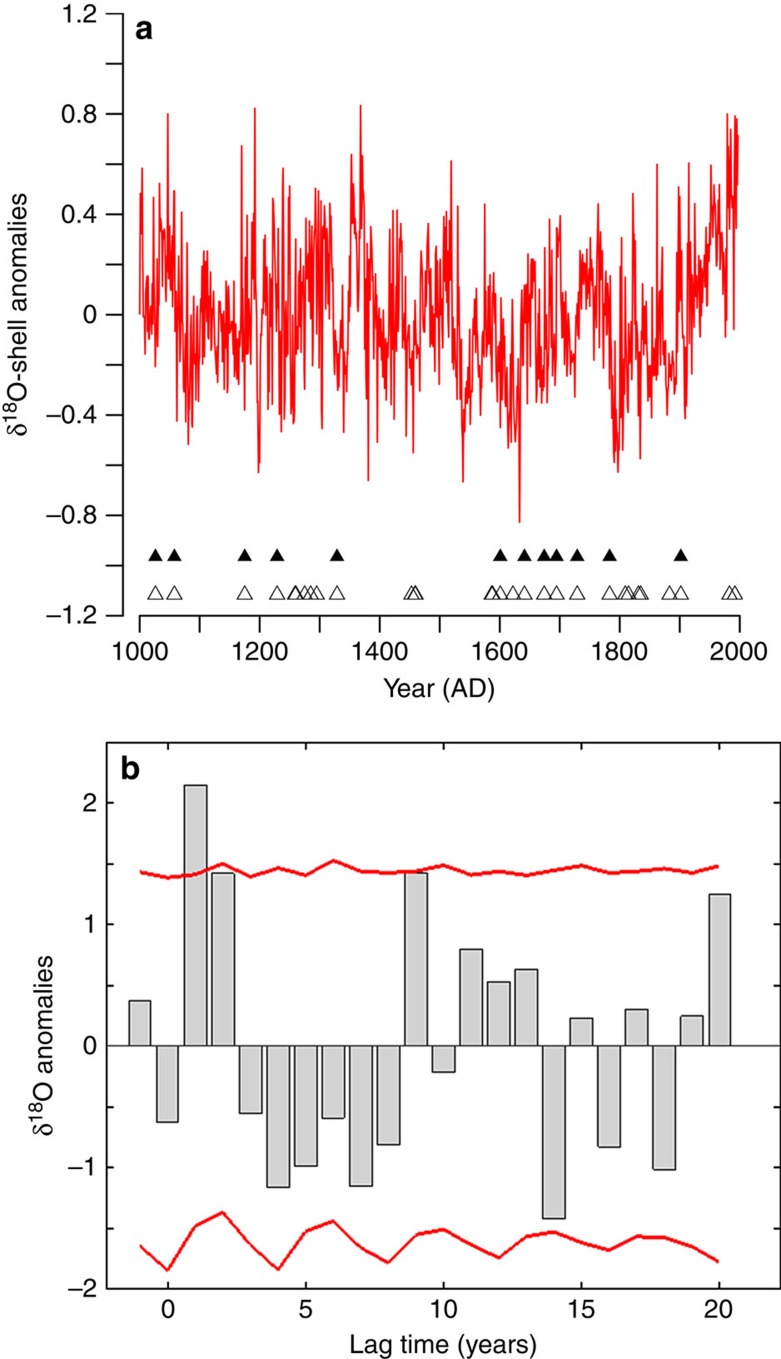
Figure 6. SEA of the δ18O-shell series.
The SEA was conducted between the 12 largest volcanic eruptions of the last 1,000 years and the annually resolved δ18O-shell series. (a) The annually resolved δ18O-shell series (red line); the triangles indicate the timing of the 12 (black filled triangles) and 30 (open triangles) largest volcanic eruptions, respectively. (b) SEA analysis of the δ18O-shell series using the 12 largest eruptions. The grey bars indicate the mean δ18O-shell series anomalies in over the 12 analysis windows. The red lines indicate the 95% significance level derived using a bootstrapping methodology.

