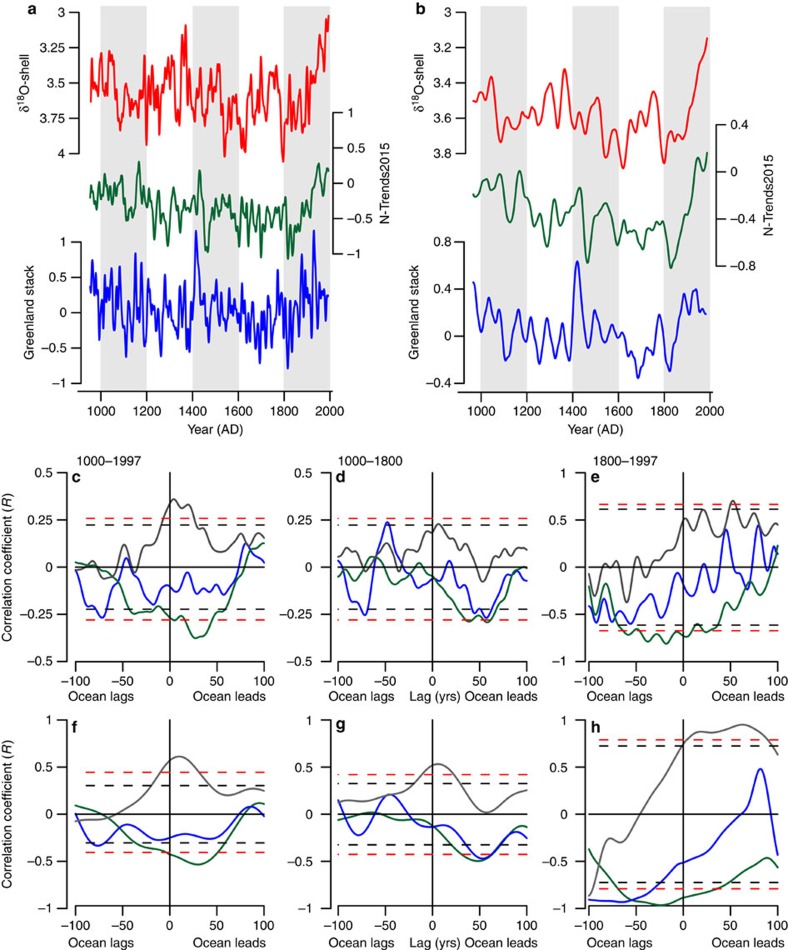
Figure 7. Lead-lag correlation analysis between the inverted δ18O-shell anomalies and NHSATs.
NHSATs derived from a composite dendrochronological series11 and Greenland air temperatures derived from a stack of Greenland ice cores13. (a) Ten-year and (b) 50-year loess first-order low-pass-filtered δ18O-shell anomalies (red lines), Northern Hemisphere air temperatures (green lines) and Greenland air temperatures (blue lines). (c–h) Lead–lag correlation plots calculated between the δ18O-shell series and Northern Hemisphere air temperatures (green lines), the δ18O-shell series and Greenland air temperatures (blue lines), and Northern Hemisphere air temperatures and Greenland air temperatures (grey lines). The correlations are calculated over three periods. (c,f) Correlations calculated over the entire millennium. (d,g) Correlations calculated over the pre-industrial period (AD 1000–1800). (e,h) Correlations calculated over the industrial period (AD 1800–1997). Data used in the correlations in plots c–e were 10-year loess first-order low-pass filtered, whereas the data used to calculate the correlations in plots f–h were 50-year loess first-order low-pass filtered. The dashed black and red lines in plots (c–h) represent the respective 90 and 95% significance levels calculated using 1,000 Monte Carlo simulations using the Ebisuzaki method37.

