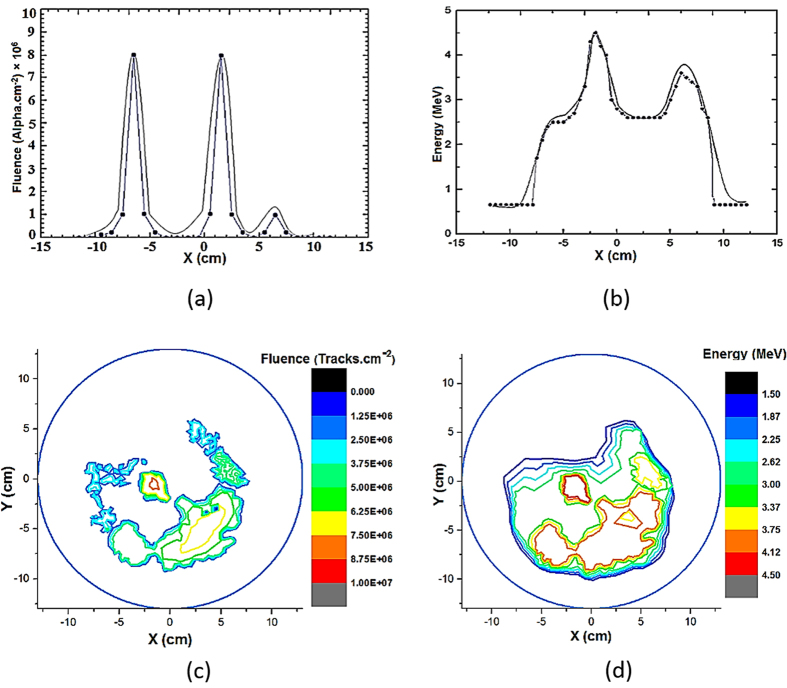
Figure 3.
(a–d) Ion angular isofluence and isoenergy distributions. Helium ion fluence (a) and ion energy (b) angular distributions profiles on the X axis as well as helium ion isofluence (c) and isoenergy (d) distributions on a circular MSPC detector (26 cm diameter) exposed at a distance of 6 cm from the “anode top” (see also Figs 1 and 2).

