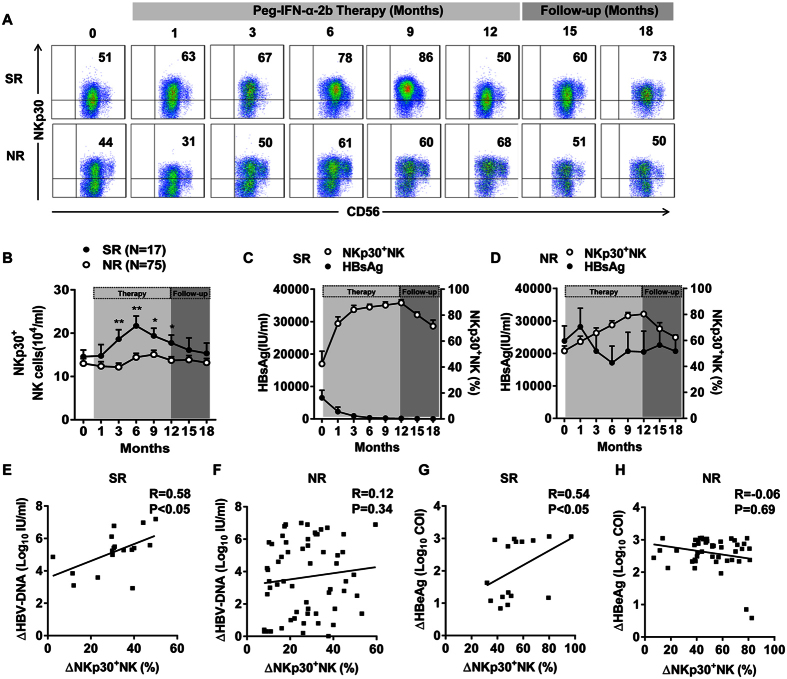
Figure 2. Peg-IFN-α-2b treatment persistently increased NKp30 expression on NK cells, especially in the SR patients, which correlated with clinical outcomes.
(A) Representative dot plots show NKp30 expression on NK cells upon treatment in a representative patient. (B) Absolute numbers of NKp30+ NK cells during Peg-IFN-α-2b therapy and follow-up in the SR and NR patients. (C,D) Cumulative longitudinal data of the plasma HBsAg concentration (IU/mL) and the percentage of NKp30+ NK cells in the SR and NR patients. (E,F) Spearman’s rank correlation coefficient between the change in log10 HBV-DNA and the change in NKp30+ NK cells was determined. (G,H) Spearman’s rank correlation coefficient between the change in log10 HBeAg and the change in NKp30+ NK cells was determined. ΔLog10 HBV-DNA (IU/ml) = Log10 HBV-DNAbaseline (IU/ml) − Log10 HBV-DNA12 months (IU/ml); ΔNKp30+ NK cell (%) = NKp30+ NK cell (%)12 months − NKp30+ NK cell (%)baseline; ΔLog10 HBeAg (COI) = Log10 HBeAg (COI)baseline − Log10 HBeAg (COI)12 months. Horizontal bars indicate the mean values with the standard error of the mean. Analyses of unpaired data were performed using the Mann-Whitney U-test, *p < 0.05, **p < 0.01.

