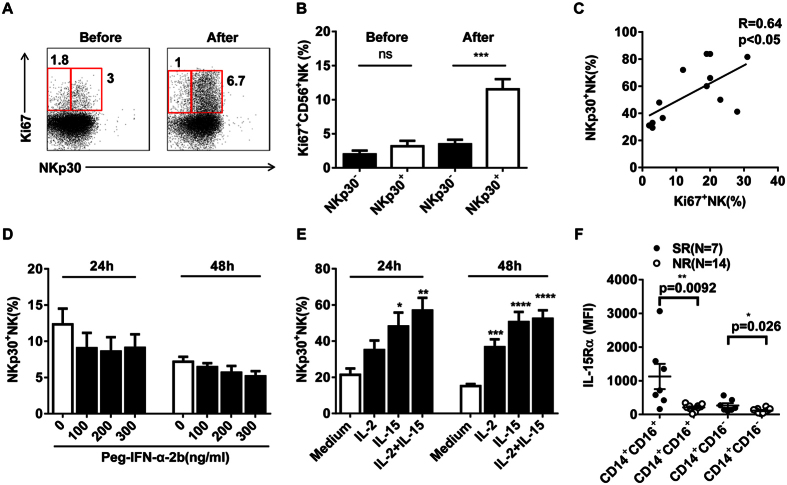
Figure 3. IL-15 drives NKp30+ NK cell proliferation, which could not be induced by Peg-IFN-α-2b.
(A) The proportion of NKp30+ NK cells expressing Ki-67 before and after the start of Peg-IFN-α-2b therapy in a representative patient. (B) Ki-67 expression was significantly higher on NKp30+ NK cells after the start of Peg-IFN-α-2b therapy than at baseline. (C) The relationship between the percentage of Ki67+ NK cells and NKp30+ NK cells. The Spearman correlation coefficient (r) and p-values are indicated. (D) The percentage of NKp30+ NK cells was not altered by Peg-IFN-α-2b treatment. (E) The percentage of NKp30+ NK cells was altered by stimulation with IL-2 (100 U/ml), IL-15 (10 ng/ml), or IL-2 (100 U/ml) plus IL-15 (10 ng/ml). (F) The mean fluorescence intensity (MFI) of IL-15Rα (CD215) expression on two subsets of monocytic cells from the SR (black) and NR (white) patients. Horizontal bars indicate the mean values with the standard error of the mean. Analyses of unpaired data were performed using the Mann-Whitney U-test, and analyses of paired data were performed using the Wilcoxon test, *p < 0.05, **p < 0.01, ***p < 0.001, ****p < 0.0001.

