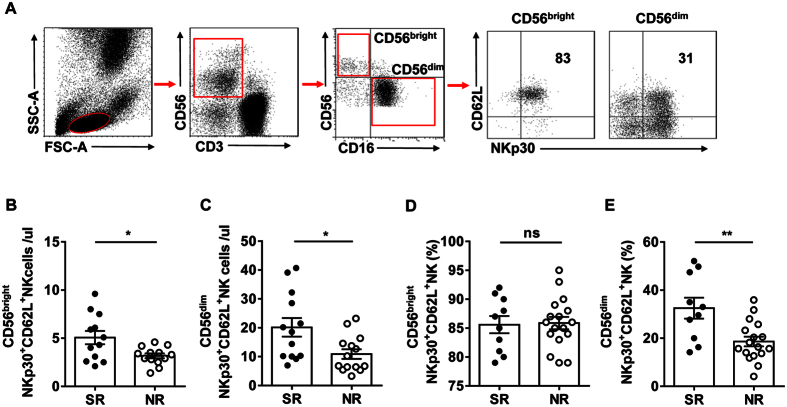
Figure 5. SR patients had more CD62L+ NKp30+ NK cells than NR patients at the end of Peg-IFN-α-2b therapy.
(A) Gating strategy. (B,C) Absolute numbers of CD56btight CD62L+ NKp30+ NK and CD56dim CD62L+ NKp30+ NK cells in the SR patients and NR patients after the start of Peg-IFN-α therapy. (D,E) The percentage of CD56dim CD62L+ NKp30+ NK cells was higher in the SR patients than in the NR patients after the start of Peg-IFN-α-2b therapy. Horizontal bars indicate the mean values with the standard error of the mean. Statistical analyses were performed using the Mann-Whitney U-test, *p < 0.05; **p < 0.01.

