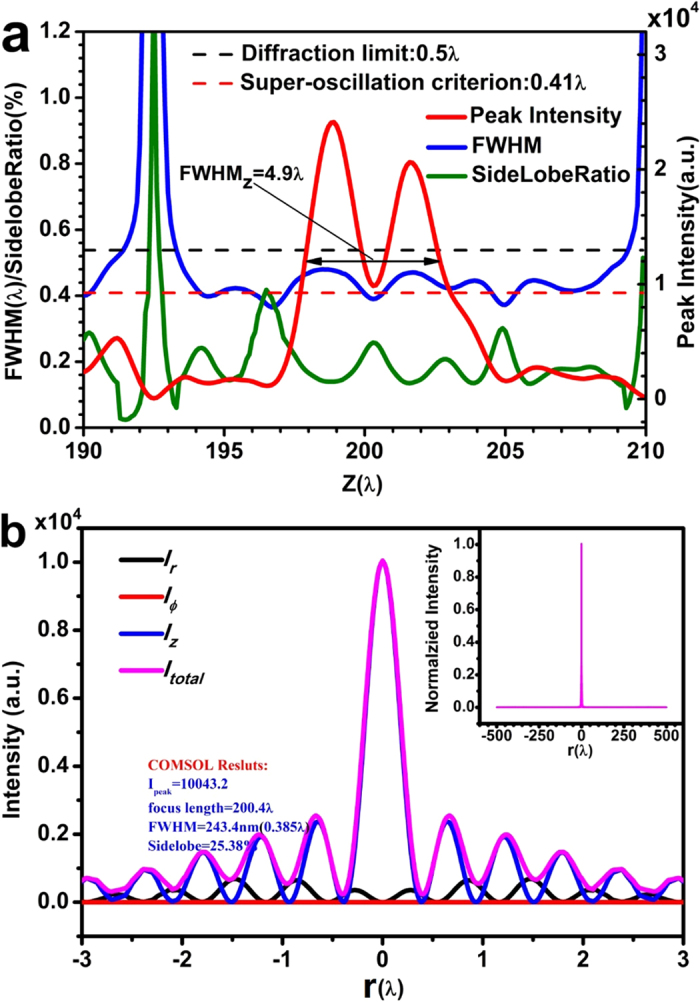
Figure 4. COMSOL numerical simulation results.

(a) the spot FWHM (blue), sidelobe ratio (green), and intensity (red) distribution on the optical axis near the focal point, where the black dashed line and red dashed line indicate the diffraction limit and super-oscillatory criterion, respectively; (b) the total optical intensity (pink), and the intensities of radial (black), azimuthal (red) and longitudinal (blue) components on the focal plane at z = 200.4λ.
