
Figure 7. Color maps of the optical intensity on the y-z plane near the focal point.
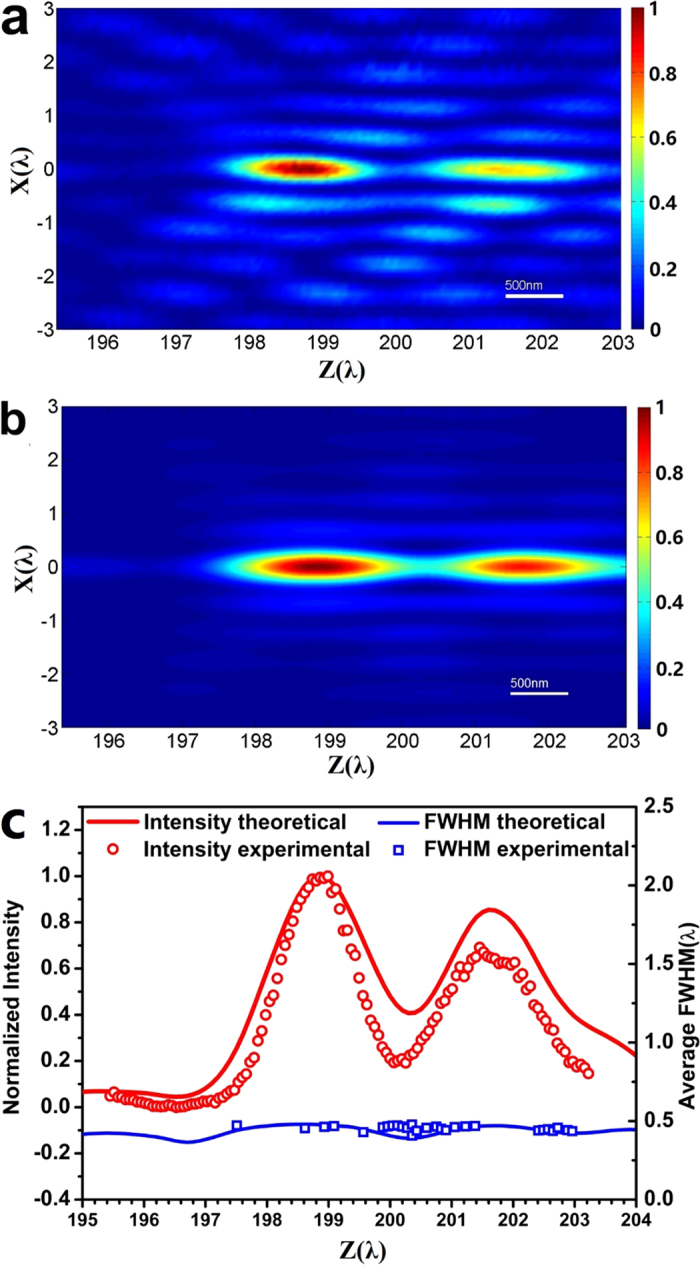
(a) the experimental result; (b) the numerical simulation; (c) optical intensities on the optical axis (z-axis) near the focal point: numerical simulation (red curve) and experimental result (red circles); and the transverse FWHM on the optical axis near the focal point: numerical simulation (blue curve) and experimental result (blue squares).