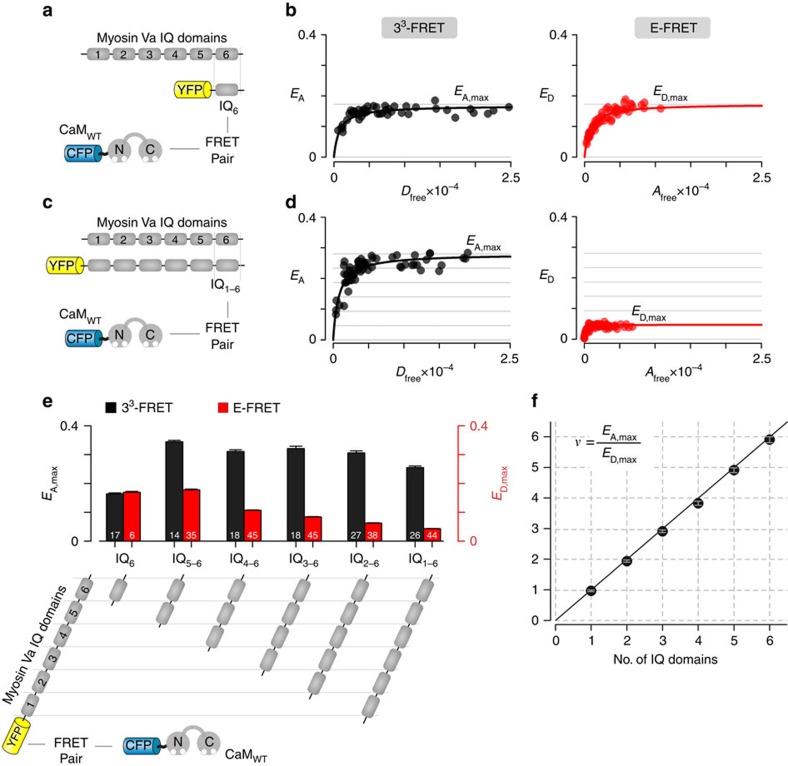
Figure 3. Stoichiometry of calmodulin interaction with myosin Va neck domain.
(a) Schematic illustrates FRET binding pairs ECFP tagged CaM and EYFP tagged myosin Va peptide containing a single IQ domain (IQ6). (b) Left, 33-FRET efficiency (EA) is plotted against estimated free donor concentration (Dfree). Each black symbol corresponds to data from a single cell. Right, E-FRET efficiency (ED) is plotted as a function of estimated free acceptor concentration (Afree). The maximal 33-FRET efficiency (EA,max) is approximately equal to maximal E-FRET efficiency (ED,max). (c) Cartoon illustrates FRET pairs ECFP-CaM and EYFP-tagged full length myosin Va neck domain peptide containing six IQ domains (IQ1-6). (d) Left, 33-FRET efficiency as a function of free donor concentration (Dfree). Right, E-FRET efficiency is plotted against free acceptor concentration (Afree). In both cases, each symbol corresponds to FRET measurement from a single cell. Notice that EA,max is ∼6-fold larger than ED,max suggesting 6:1 donor:acceptor stoichiometry. (e) Bar-graph summary depicts maximal 33-FRET (black) and E-FRET (red) efficiencies for binding of ECFP-CaM with various YFP-tagged truncations of myosin Va neck domain containing varying number of IQ domains as shown in cartoon below (mean±s.e.m.; n, number of cells, as labelled for each bar). (f) Experimentally determined FRET-based stoichiometry ratio (ν) follow the identity relation with the number of IQ domains within each truncation shown in e. Each symbol, mean±s.e.m.

