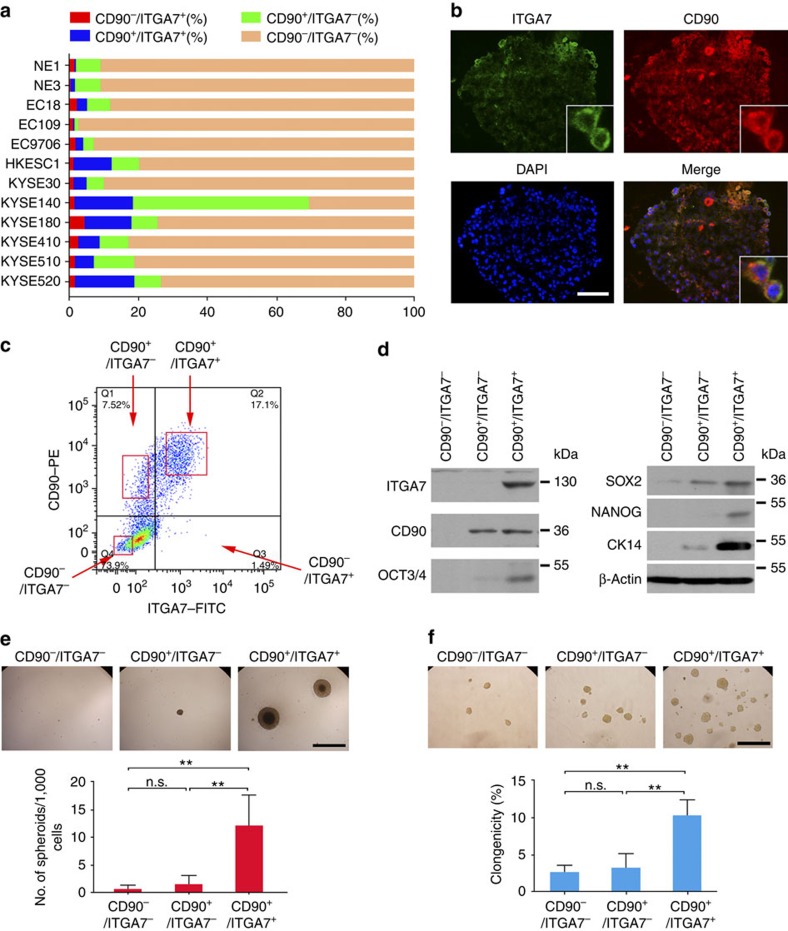
Figure 2. ITGA7 and CD90 is co-expressed in OSCC and marks a more tumorigenic OSCC subpopulation.
(a) Summary of the overlap of ITGA7+ and CD90+ cells in esophageal cell lines detected by dual-colour flow cytometry. (b) Representative dual-colour immunofluorescence analyses of cryosectioned spheroids generated from KYSE520 showing the co-localization of ITGA7 (green) and CD90 (red). Scale bar, 50 μm. (c) Representative dual-colour flow cytometry analysis of KYSE520 cells for ITGA7 and CD90. The cells (dot plots) were divided into four quadrants as indicated and collected for each quadrant as gated in the red boxes. CD90−/ITGA7+ subpopulation does not exist because most ITGA7+ cells are also CD90+. Freshly isolated subpopulations were detected by western blotting analysis (d), and subjected to spheroid formation assay (e, Scale bar, 500 μm) and soft agar colony formation assay (f, Scale bar, 500 μm). Data are represented as mean±s.d. of three separate experiments. Statistics: (e,f) ANOVA with post hoc test. **P<0.001; n.s., P≥0.05.

