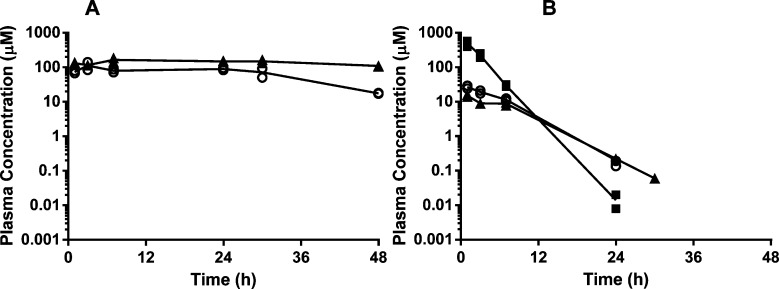
Figure 3.
Plasma concentration versus time profiles of (A) 16 (filled triangles) and 14 (open circles) and (B) 13 (filled squares), 23 (open circles), and 26 (filled triangles), following oral administration of 100 mg/kg to male Swiss outbred mice. Symbols represent individual data points, and the lines represent the mean profiles.

