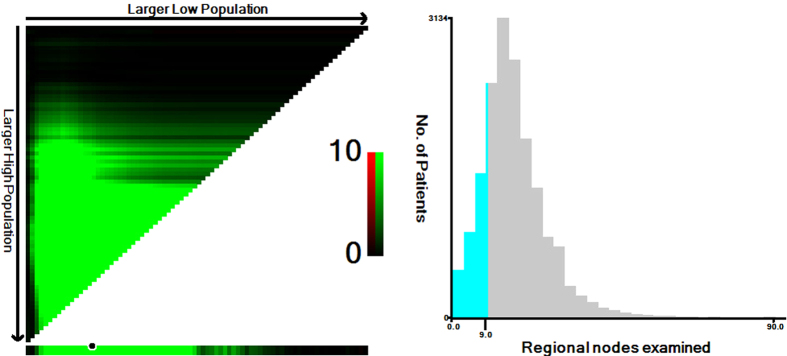
Figure 2.
(A) X-tile plots for number of lymph nodes constructed by patients aged ≥80. The plots show the χ2 log-rank values produced, dividing them into 2 groups by the cutoff point 9. The brightest pixel represents the maximum χ2 log-rank value. The data are represented graphically in a right-triangular grid where each point represents the data from a given set of divisions. The vertical axis represents all possible “high” populations, with the size of the high population increasing from top to bottom. The horizontal axis represents all possible “low” populations, with the size of the low population increasing from left to right. Data along the hypotenuse represent results from a single cut-point that divides the data into high or low subsets. (B) The distribution of number of patients aged ≥80 according to lymph nodes count. Number of lymph nodes ranged from 0 to 90.

