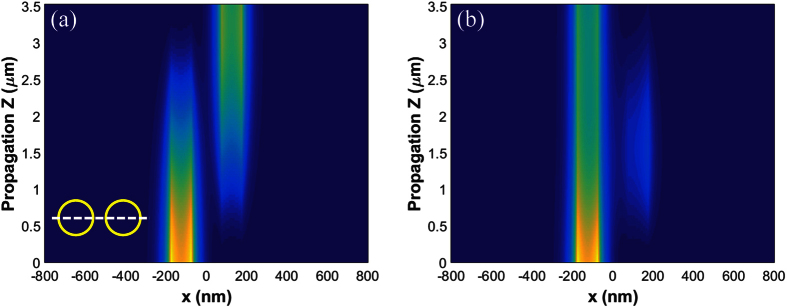
Figure 3.
Energy density distribution in (a) linear regime, P0 = 0.01 mW. (b) Nonlinear regime, P0 = 2.9 mW. The wave is launched in the left GNW. Bottom left corner of panel (a) shows cross-section of the pair of waveguides with dashed line indicating the plane on which we plot the spatial distribution of energy density.

