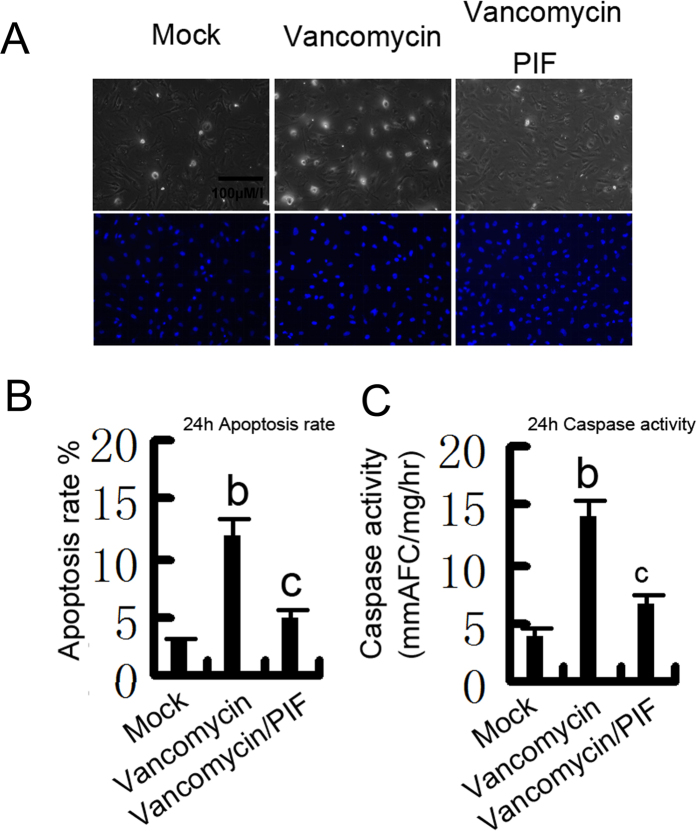
Figure 6. Effects of p53 inhibition on VAN induced apoptosis in HK-2 cells.
HK-2 cells were treated with 4 mm/L vancomycin in presence or absence of 20 μM pifithrin-α for 24 h. (A) Morphology. Cells were stained with Hoechst33342. Cellular and nuclear morphology was recorded by phase-contrast and fluorescence microscopy. Bar: 100 μM/I. (B) Apoptosis was estimated as a percentage by counting the cells with typical apoptotic morphology. (C) Caspase activity. Cell lysate was collected for enzymatic assay of caspase activity. Data were expressed as means ± SD; the bars with different superscripts (a–c) in each panel were significantly different (P < 0.05). Data are representative of at least four separate experiments.

