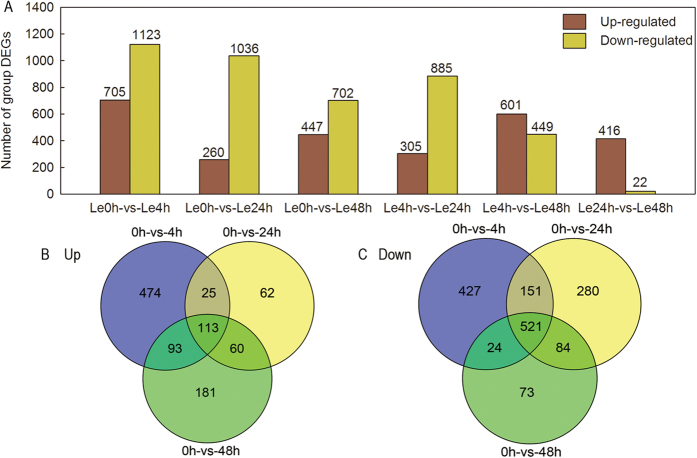
Figure 1. The number of DEGs among all samples after DADS treatment.
(A) the number of up/down-regulated genes compared between different lengths of DADS treatment. (B,C) Venn diagram for DEGs identified at each time point after DADS application. The threshold of FDR ≤ 0.05 and log2|FC (ratio of DADS/control)| ≥ 1 were used to judge the significant differences in gene expression.

