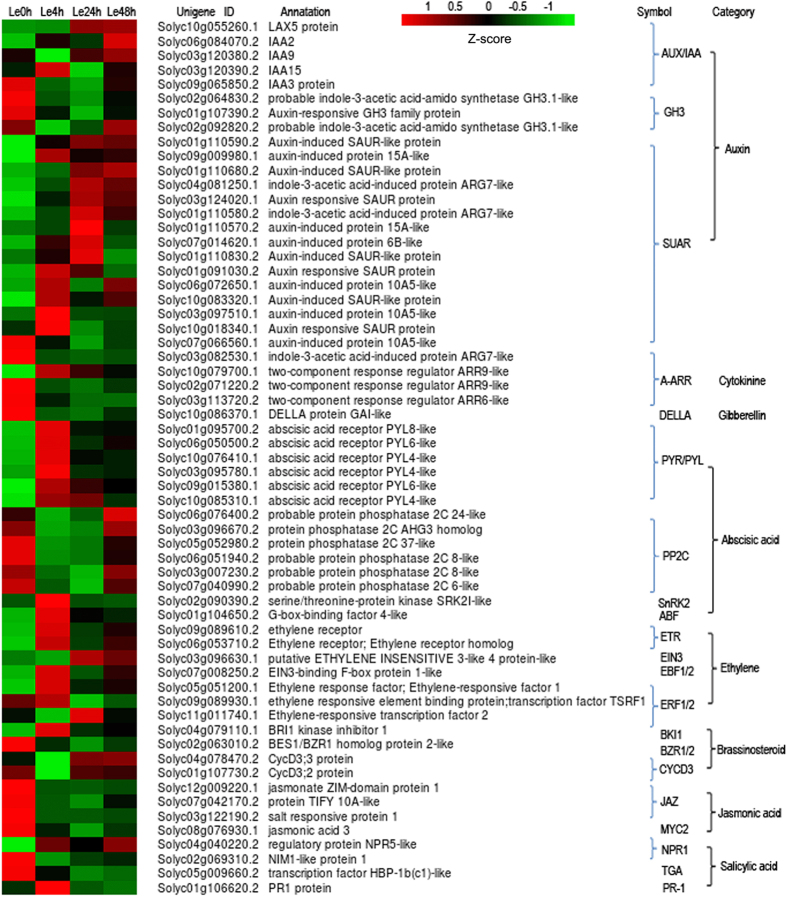
Figure 5. Heat map of transcriptional levels for DEGs enriched in plant hormone signal transduction pathways through KEGG analysis.
In this heat map, the columns represent tomato root samples treated with DADS for different times, and the rows represent DEGs enriched in plant hormone signal transduction. Relative expression levels were normalized based on the Z-score and shown as a color gradient from low (green) to high (red).

