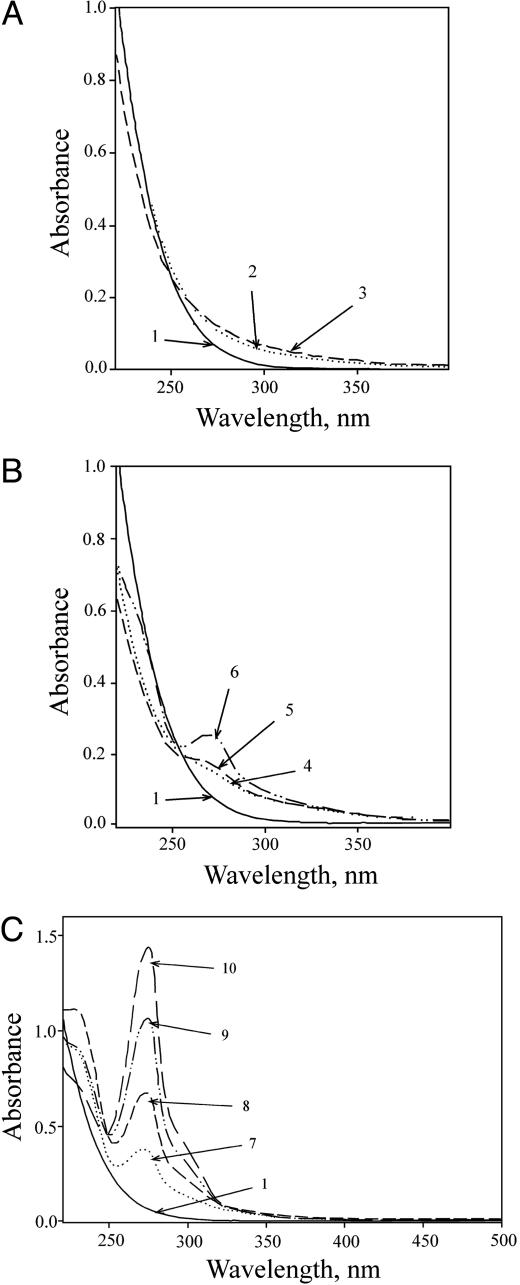
Fig. 1.
Absorption spectra during the Mn + H2O2 +  reaction. Reactions were started by adding NaHCO3 to 20 mM to 10 mM H2O2, 0.1 mM MnCl2, and 100 mM Tris chloride at pH 7.4. (A) Spectra taken at 0, 1, and 3 min (lines 1, 2, and 3). (B) Spectra taken at 0, 6, 10, and 20 min (lines 1, 4, 5, and 6). (C) Spectra taken at 0, 30, 50, 80, and 120 min (lines 1, 7, 8, 9, and 10). The zero time spectrum was taken before the addition of
  .
.

