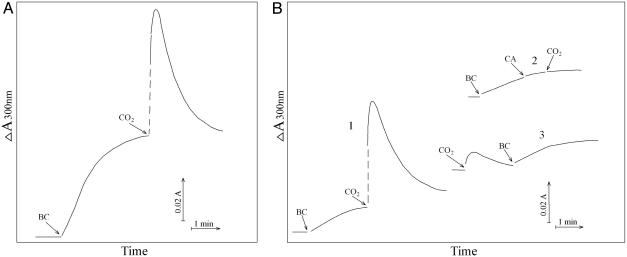
Fig. 4.
Effect of CO2 on absorbance at 300 nm. (A) Conditions were as in Fig. 1. Reaction was started by addition of  at the first arrow and 0.15 ml of ice water saturated with CO2 added to the total volume of 3.0 ml at the second arrow. (B) Conditions were as in Fig. 1 except that
  was added to 10 mM. Line 1,
  added at the first arrow. Line 2, carbonic anhydrase (CA) was added to 50 μg/ml at the second arrow and CO2 added at the third arrow. Line 3, CO2 added at the first arrow and
  added at the second arrow.

