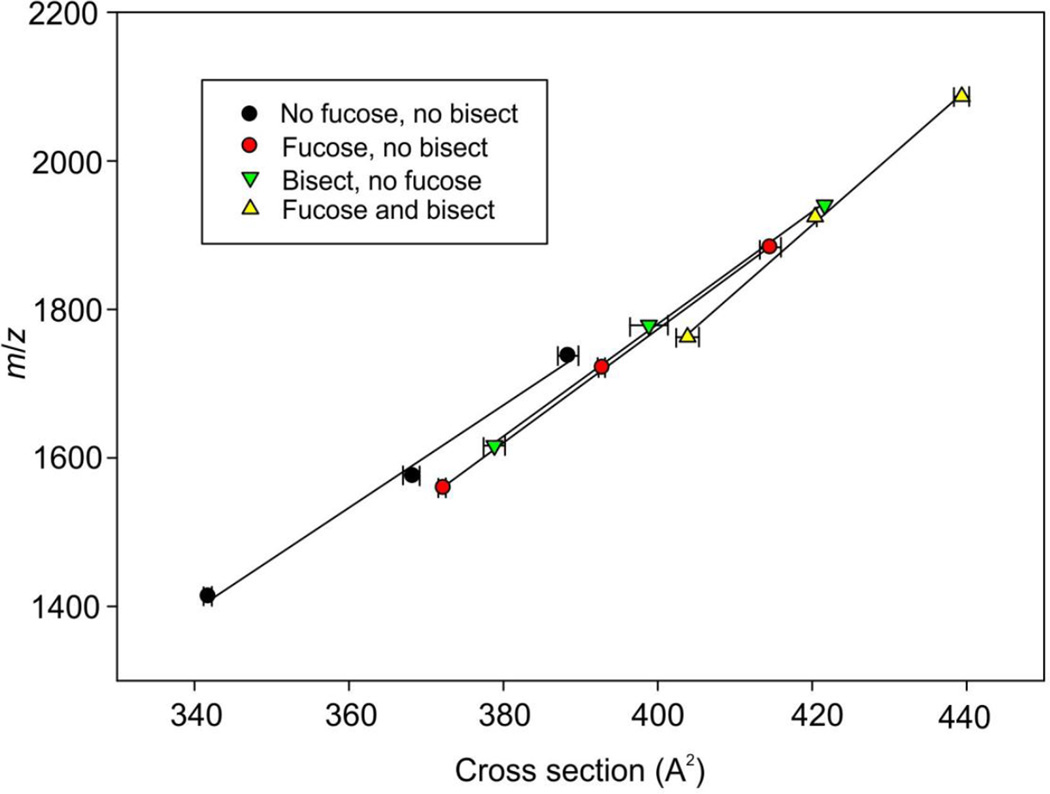
Figure 3.
Plot of estimated cross sections against m/z for the phosphate adducts of biantennary glycans from IgG with zero, one and two galactose residues. The four lines connect these glycans having additional core fucose (13-16, red circles), bisecting GlcNAc (24-27, green inverted triangles), both fucose and bisecting GlcNAc (30-33, yellow triangles) and no additional substituents (9-12, black circles). Error are standard deviations (n = 5).

