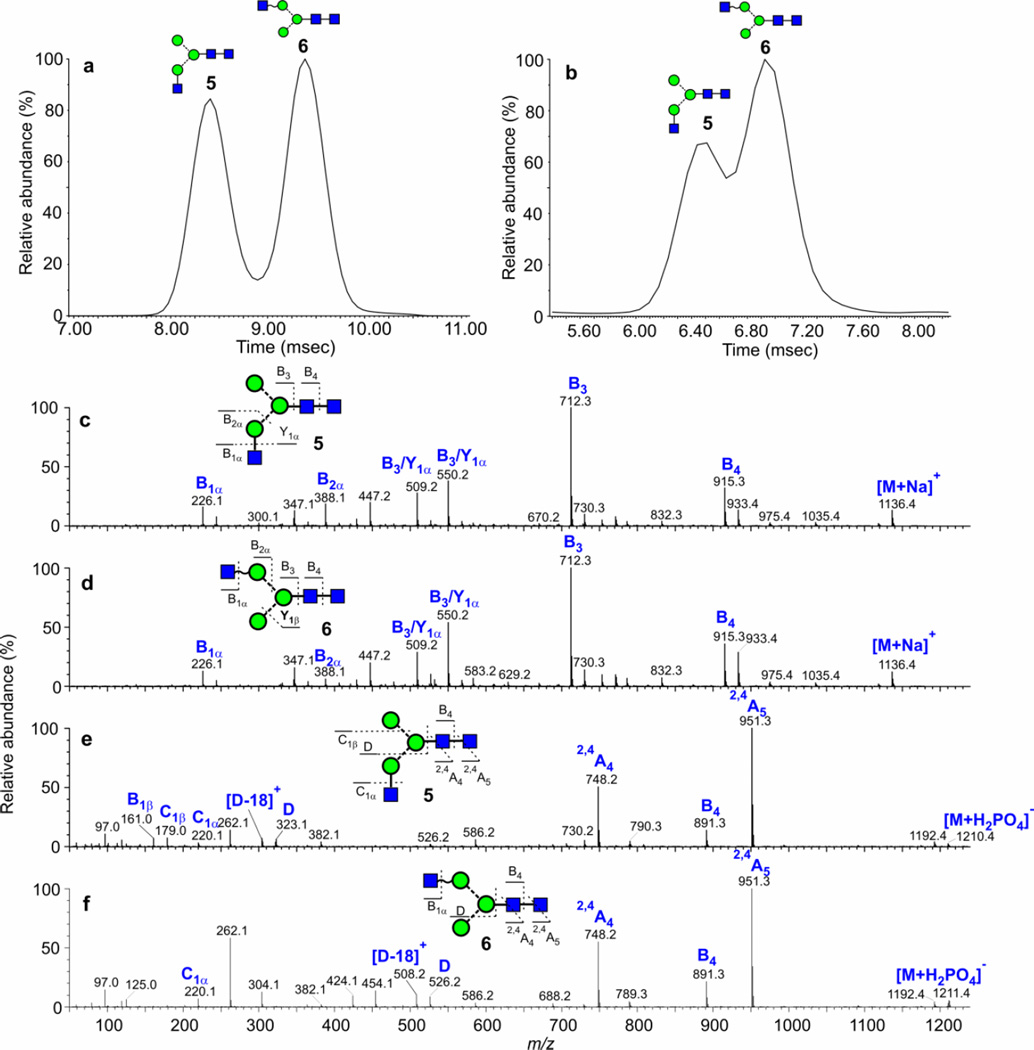
Figure 4.
(a) ATD plot of m/z 1136 (Man3GlcNAc3, 5, 6, M+Na]+ ion) from chicken ovalbumin recorded with the Synapt G2 instrument (wave velocity 600 m/sec, wave height 40 V) showing separation of isomers. (b) Corresponding negative ion plot ([M+H2PO4]− ions, wave velocity 450, wave height 40 V), (c and d) Positive ion CID spectra of the compounds producing the two peaks in the ATD profile shown in panel a. (e and f) Negative ion CID spectra of the compounds producing the two peaks in the ATD profile shown in panel b. Fragment ions are labelled according to the scheme proposed by Domon and Costello48.

