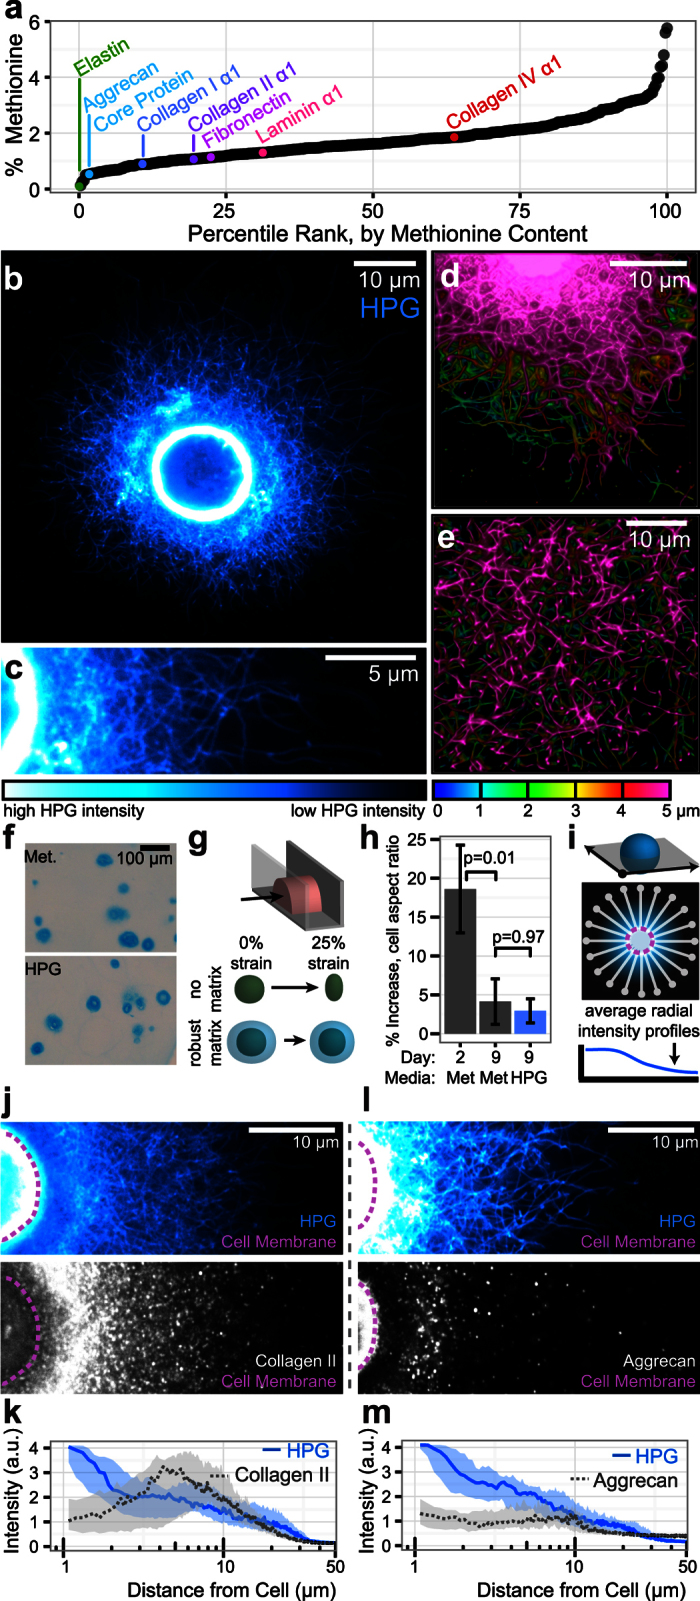
Figure 1. HPG labeling enables high fidelity visualization of the extracellular matrix.

(a) Percentage methionine content of 361 extracellular matrix proteins, ordered by relative methionine abundance. (b,c) Confocal cross section of a chondrocyte cultured in agarose and continuously labeled with HPG for 9 days. (d,e) 3D reconstruction of 5 μm confocal stacks taken near the cell midplane (d) and below the cell (e) of day 9 chondrocytes. Color indicates vertical position in the stack. (f) Alcian blue staining of constructs cultured in control media with native methionine and labeling media containing HPG. (g) Schematic illustrating microcompression to assess extracellular matrix mechanics. (h) Percent increase in cellular aspect ratio following compression. Bars represent mean ± SEM (n = 40 cells/group, compared via ANOVA with Tukey’s post hoc test). (i) Schematic illustrating radial profile quantification of extracellular HPG labeling. (j,k) Images and radial profile quantification of simultaneous collagen II immunostaining and HPG labeling. (l,m) Images and radial profile quantification of simultaneous aggrecan immunostaining and HPG labeling. For (k) and (m), lines represent median intensity profile, shaded areas represent 25th to 75th percentiles (n = 20 cells/group).
