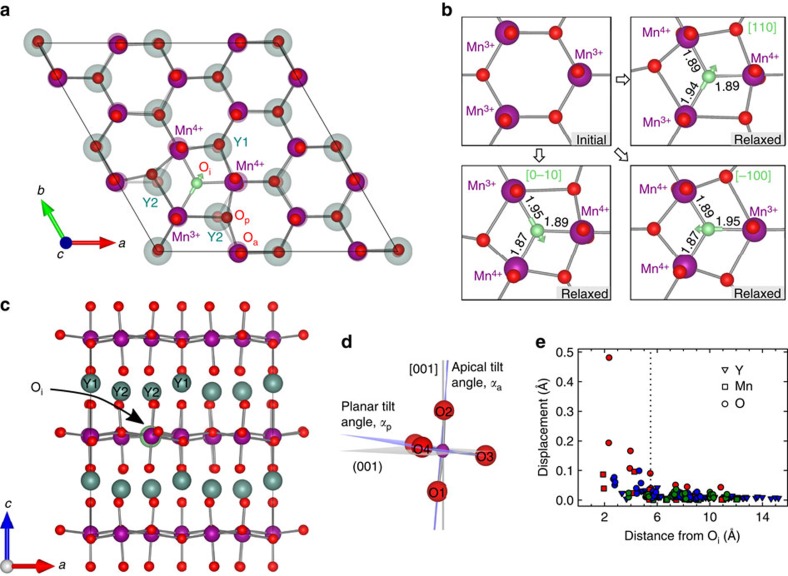
Figure 3. Structural distortions and screening length.
(a) Relaxed geometry of the (002) plane of a 2 × 2 × 1 supercell of YMnO3 with the perfect structure faded in the background for comparison. Y atoms above the (002) Mn–O plane are projected onto the plane. (b) Unrelaxed structure in upper left panel compared with relaxed structures around Oi in the three triple-well positions around the 2/3, 2/3, 1/2 position. The green arrows on Oi indicate the displacement towards the two Mn4+. Bond lengths between Oi and Mn are given in Å. (c) YMnO3 with Oi (green sphere in the (002) Mn–O layer) viewed along the b-direction. (d) Apical and planar tilting angles of the trigonal bipyramids. O1 and O2; and O3 and O4 being apical and planar oxygens, respectively. (e) Displacements of ions with respect to the perfect structure as a function of distance from Oi. The red symbols represent atoms in the same Mn–O layer as Oi is positioned, the blue symbols represent the apical oxygens and the yttrium atoms closest to the Mn–O layer with Oi, and the green symbols show atoms in the adjacent Mn–O layers. The structural screening length is indicated by a vertical dotted line.

