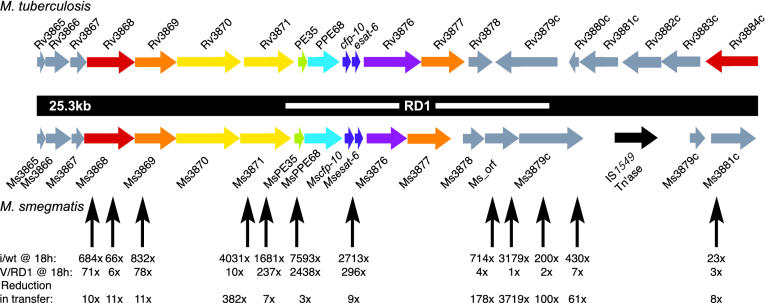
Fig. 3.
Alignment of the M. tuberculosis and M. smegmatis RD1 regions. ORFs are colored according to their putative functions, which were derived from the pfam and tuberculist databases (18, 19), as follows: red ORFs encode AAA domains (pfam accession no. PF0004); orange ORFs encode putative transmembrane proteins; yellow ORFs encode FtsK/SpoIIIE domains (PF01580, note that the FtsK/SpoIIIE and AAA domains are specific examples of the AAA+ domain); green ORFs encode PE (PF00934) proteins; cyan ORFs encode PPE (PF00823) proteins; purple ORFs encode members of COG0455 (35), ATPases involved in chromosome partitioning are shown. The functions of the gray ORFs are unclear. An ORF corresponding to the transposase of IS1549 is black. M. smegmatis ORFs (Ms) were given names reflective of the closest M. tuberculosis (H37Rv) homologue. Note that the genes downstream of Ms3878 and Rv3878, although conserved, are not in the same orientation. This finding contradicts previous computational predictions of the region (27) but is in agreement with sequencing analyses from both our laboratory and the tigr database. Ms-orf is a predicted gene with no known M. tuberculosis homologue. The white bar indicates the RD1 deletion originally defined in BCG, which also attenuates M. bovis and M. tuberculosis. Black vertical arrows below the maps represent mariner/Kmr insertions, which increase DNA transfer. For clarity, a third insertion in Ms3871 and an insertion 2.6 kb downstream of Ms3881c, which also elevates DNA transfer, are not shown. The fold increase (i/wt) in DNA transfer for each insertion mutant (i) compared with wild type (wt), after an 18-h mating, is shown immediately below each arrow. In these experiments, the wild-type transfer frequency was 1 × 10⁻⁵ events per donor cell. Mutant transfer frequencies were determined from five independent crosses. V/RD1 indicates the fold increase in DNA transfer for the mutants when complemented with an integrated M. tuberculosis cosmid encompassing the entire region. These frequencies are compared with just the cosmid vector (v) integrated into the attB site of M. smegmatis. The bottom row indicates the overall reduction in transfer frequency (i.e., the extent of complementation).

